Profitable Trading
If you are serious about making some consistent long-term profits from forex trading, you need to be constantly looking out for high probability set-ups where the odds of success are firmly in your favor.
Therefore you generally want to be trading with the prevailing long-term trend rather than against it, and you also need to time your entries and your exits so that you maximize your returns when the trend is strongest.
So with this in mind, I thought I would tell you about two technical indicators that will help you to enter positions at the right times, and prevent you from making any bad trades.
ROC n ROLL Indicator
The ROC n ROLL indicator is hidden away on the ProRealTime charting platform, so it may only be available if you subscribe to this service or if you use a broker that uses this charting platform. However I think you can probably download it if you use the MT4 platform.
This indicator is one of the easiest to use because it takes the form of a histogram and is either green, red or blue at any given time.
A green bar indicates a bullish trend, a red bar indicates a bearish trend and a blue bar indicates that there is no clear trend.
This is useful because you can use this data to identify the current trend on multiple time frames to assess the overall trend of your favorite forex pairs.
It is generally a good idea to look at two higher time frames before entering positions on a lower time frame. So for instance, if you are trading the GBP/USD on the 1-hour chart, you might want to look at the current trend on the 4-hour and daily chart before entering any positions.
Ideally you want to see a strong consecutive run of either green bars or red bars on both of these longer time frames because this indicates a very strong trend.
You can then attempt to look for good opportunities to go long or short on the lower time frame, either when the ROC n ROLL indicator turns the same color, or by using some other entry method, such as a moving average or MACD crossover, for example, or an RSI or stochastic indicator crossing through the 50 level.
If the ROC n ROLL indicator is blue on one of the longer time frames, and particularly if there are lots of blue bars, this will keep you out of trouble and prevent you from making any bad trades because it is basically telling you to stay out of the markets at the current time.
To demonstrate this point, if you look at the weekly chart of the GBP/USD pair since 2016, the ROC n ROLL indicator has largely been blue or red as the price has continued falling, so this would automatically have prevented you from being tempted to trade any reversals on the daily chart and taking some low probability trades.
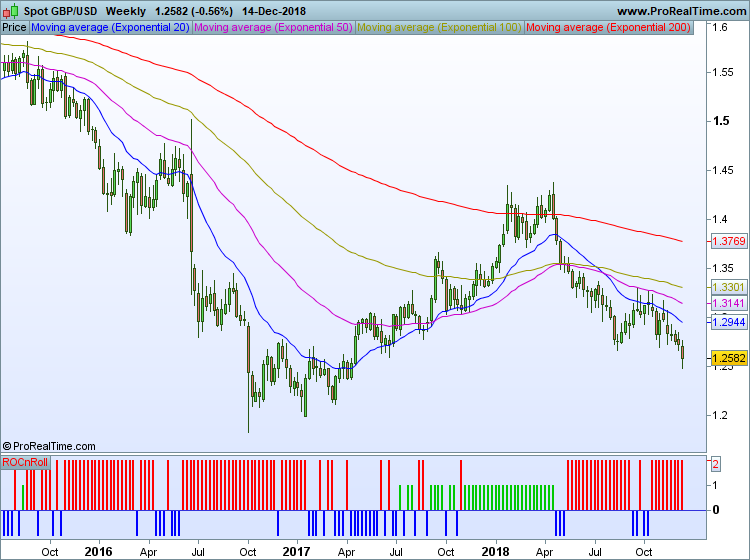
However you could still have profited from some long positions on the lower time frames at one point because it turned green (and stayed green) on this weekly time frame for several months between November 2017 and April 2018.
ADX Indicator
Another indicator that can help to improve your overall success rate and prevent you from entering trades at the wrong time is the ADX indicator because this indicates the overall strength of the current trend.
This is derived from quite a complex formula, but in simple terms, the ADX and ADXR lines on the chart are momentum indicators, and a clear trend is established when the ADX rises above the 17 or 23 level (depending on your preference).
A rising ADX indicates a strong trend, which will help keep you in a profitable position and run your profits, while a falling ADX suggests that the trend is getting weaker (or the new trend is fairly weak).
However you will often get a signal to exit a position long before this because when the ADX indicator crosses below the ADXR indicator, it basically tells you that the trend is pretty much over.
If the ADX is below 17 (or below 23 as favored by some traders), you shouldn’t be in a position because there is no clear trend at the moment.
You can see how effective this ADX indicator is by looking at the same weekly chart of the GBP/USD pair:
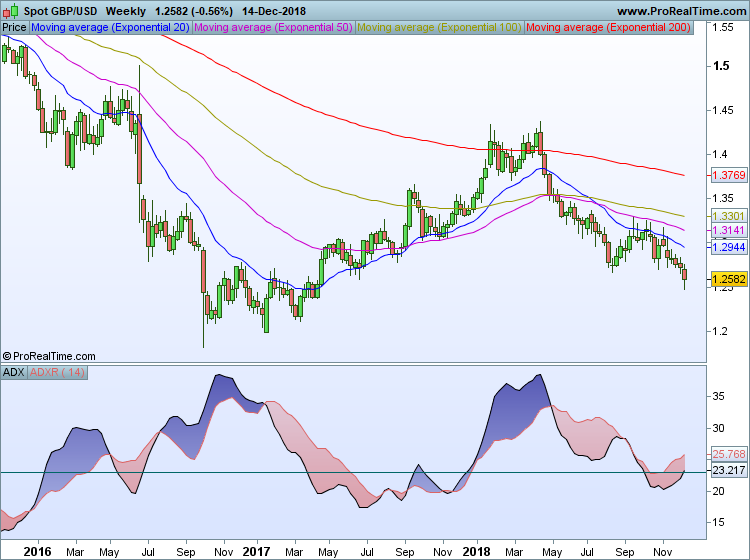
Once again, you can use this indicator on multiple time frames to get a better idea of the strength of the overall trend on the long-term charts before entering positions on the shorter-term time frame.
The point is that both of these indicators are extremely useful, particularly if you use them both together because you will instantly know both the strength and the direction of the overall trend.

Leave a Reply