The Forex Chronicles

  • Rebates
  • Brokers
  • News
  • Analysis
  • Signals
    • Best Copy / Social Trading Platforms
    • eToro Review
    • FXTM Invest Review
    • Marketclub Review
    • ZuluTrade Review
  • Indicators
  • Strategies
  • Articles

Archives for September 2018

Bitcoin’s Peaks Are Getting Lower – Needs To Break Above $7000

September 28, 2018 by James Woolley Leave a Comment

Bitcoin Predictions

It is always interesting to keep an eye on the price of Bitcoin because in the past we have seen some crazy price swings.

Indeed there was a time when it rocketed up to around the $20,000 level and so-called experts were throwing out outlandish price targets.

For example, venture capitalist Tim Draper set a price target of $250,000 and John Pfeffer (a partner of Pfeffer Capital) set a price target of $700,000, while the controversial figure John McAfee suggested that the price of Bitcoin could even hit $1,000,000 by 2020.

Maybe these predictions will come true in the future, but at the moment they seem absolutely crazy based on the recent price action.

Bitcoin’s Recent Price Action

The chart below shows how the price of Bitcoin has moved since April, and it is clear to see that there has been a steady decline downwards.

Bitcoin Chart - September 2018

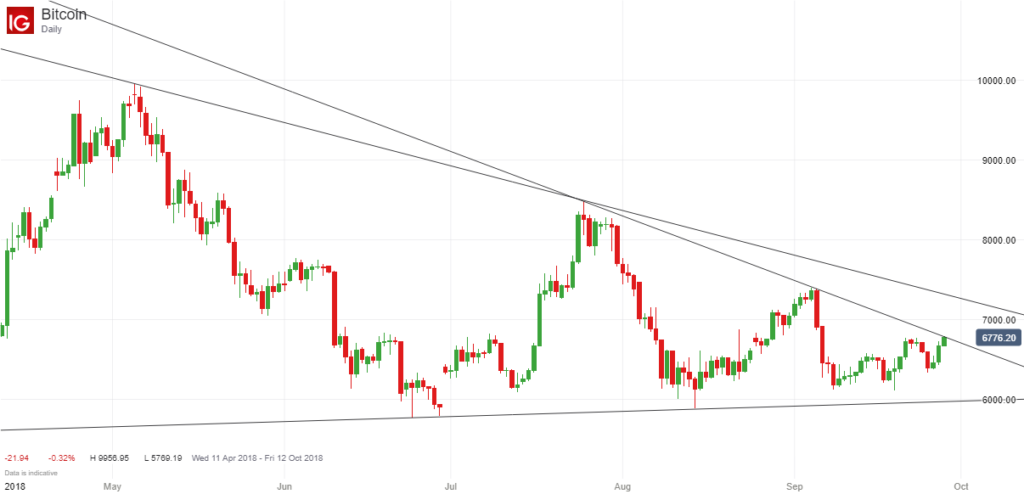
There have been times when the price has surged higher, but nevertheless the highs have been getting lower and lower, and just recently the price seems to have been stuck in a sideways trading range between around $5800 and $6600, with no real momentum to take it higher.

This week we have seen a little more strength with the price now trading at $6776 at the time of writing, but it is still far too early to call this a bull run.

Upward Price Breakout / Trading Opportunity

If I was looking to trade a possible breakout, I would look for two events to occur.

First of all, I would want the price to close above its most recent September highs ($6774) because this would push the price above the most recent trendline and potentially signal a short-term breakout.

Secondly, I would want to see the longer term trendline being broken because this would show significant strength, and may possibly bring a wave of new buying because it would encourage traders and investors to buy into this upward price breakout.

For these two things to happen, the price of Bitcoin is going to need to break through the $7000 level, and possibly as high as $7200 or $7300 (depending on when it occurs). However this is still quite a big ask because the price has been trading in the $6000s for quite some time now, so there is obviously a chance that it won’t happen at all.

There will be a breakout at some point, but it could easily be a downward breakout below $5800 if this latest breakout attempt fails to materialise.

Please note that these are just my own thought and opinions. I am not providing any trading advice or recommending any trades. Bitcoin trading is exceptionally risky and you should always be aware of these risks before entering any trades.

Filed Under: Analysis Tagged With: bitcoin, bitcoin price, breakout

Gold Continues To Trade In Narrow Range Around $1200

September 25, 2018 by James Woolley Leave a Comment

Death Cross

If you are a regular reader of this site, you will know that I recently posted about the death cross that has just occurred on the weekly chart of gold.

This is basically where the 50-period moving average crosses below the 200-period moving average, and is generally considered to be a very bearish signal.

Since then the death cross has been confirmed, but it hasn’t resulted in a wave of sellers using this as an opportunity to drive the price lower.

This is not unexpected because these weekly signals can take a long time to unwind, but if you drop down to the daily chart, you will see that the price is really struggling for direction right now.

Narrow Trading Range

In recent weeks the price seems to have been glued to the critical $1200 level, and has struggled to break decisively above or below this significant round number with any real momentum or conviction, as you can see below:

Gold Narrow Trading Range - September 2018

So far this month it has recorded a low of $1187.8 and a high of $1214.4, but has remained in a very narrow trading range for several weeks now.

Inside Bar

In addition to trading in a very narrow range, we have also had a series of three consecutive inside bars in the last three trading sessions (if you include the Sunday session), which is always worth noting because these inside bar patterns will often present you with a profitable breakout opportunity when the price closes above or below the initial set-up bar.

Trading Opportunity

From a trading perspective, it is very hard to trade any instrument that is basically trading sideways with no clear direction, but it is still good to see such a pattern because it usually leads to a profitable set-up when the price eventually breaks out of this range.

This is particularly true when you have a series of inside bars within this sideways trading range, as is the case here.

Therefore it might be worth watching the price of gold in the coming weeks because there could be a strong price move when the price closes above or below both the set-up bar and the previous high or low of this trading range.

A downward break would arguably be preferable because we have already seen a death cross on the weekly chart, and there could subsequently be a lot of downside potential.

Nevertheless, an upward price breakout could still be worth trading because there is always the potential for the price to move back towards the 200-day exponential moving average or the 100-day exponential moving average, which currently stand at $1253.9 and $1228.3 respectively, before heading south once again.

The point is that these sideways trading ranges and inside bar formations can be very profitable to trade because in many cases the longer it remains in the range, and the longer the price trades within the initial set-up bar, the bigger the breakout once the price closes outside of this range.

To demonstrate this point, you only have to check out these two inside bar range breakouts that occurred on Bitcoin and the GBP/JPY pair last month.

Filed Under: Analysis Tagged With: breakout, gold, inside bar

AUD/USD Continues Trading In Range After False Breakout

September 24, 2018 by James Woolley Leave a Comment

Price Action in 2018

The AUD/USD hit a peak of 0.8136 back in January this year, but since then it has been in a fairly steady and consistent downward trend throughout 2018.

Indeed at the time of writing, the price of this particular currency pair is trading at 0.7273, which shows just how strong the American dollar has been this year.

AUDUSD Price Chart 2018

By drawing trendlines connecting the highs and the lows, you can see that the price has been consistently sold off at the top of the channel, and bought up each time it has traded near the bottom of the channel.

However the price did actually close strongly below this lower trendline earlier this month, suggesting that there was enough momentum to take it a low lower, but this didn’t actually turn out to be case.

False Breakout

This false breakout raises two interesting points about price action trading. First of all, not all price breakouts turn out to be profitable. Even if you have a clearly defined channel or trading range, it doesn’t necessarily follow that the price will move strongly upwards or downwards once it closes outside this range.

Secondly, it reconfirms the point that you need to be careful trading continuation patterns when the trend has already been in place for a long time already (approximately 8 months in this case). Yes there is a chance that there will be another wave downwards, but there is also a strong chance that there won’t be enough momentum to take it much lower.

With long downward trends such as this one, there is arguably more profit to be made from trading an upward price breakout because this would signify that the downward trend is over, and a new upward trend is emerging, in which case there is a lot of upside potential because it could easily move 2 or 3 times the range of the current channel.

Trading Opportunities Going Forward

At this moment in time, I wouldn’t feel comfortable going long at the bottom of the channel and going short at the top of the channel because I feel that we are due a breakout very soon.

Furthermore, I wouldn’t really want to be opening any short positions on the AUD/USD pair even if the price closed below the lower trendline once again because I’m not really confident that this pair has the potential to fall much lower.

Therefore I personally would only consider opening a long position right now, and only when the price closes strongly above the upper trendline.

If it did so, I would probably look to close half the position at the EMA (200), which is approximately 1 x the range of the channel, before moving my stop loss up to break-even and targeting 2 x the range of the channel with the second half of the position, which would give a target price of approximately 0.7700, just short of the 61.8% fibonacci retracement level.

However these are just my own personal views and in now way represents trading advice.

Filed Under: Analysis Tagged With: audusd, breakout, range trading

Brent Crude Still Struggling To Break $80

September 22, 2018 by James Woolley Leave a Comment

September Price Action

It has been very interesting to watch the price of Brent Crude this month because it has been getting very close to the $80 level without actually breaking through this key level.

I said before that $80 is acting as strong resistance, and the third significant doji candle from yesterday provides further evidence that the market just doesn’t want to see the price go higher than $80.

In that particular trading session, the price reached a high of $79.69 before being driven back down to a low of $77.81. It then closed the day close to it’s opening price at $78.23, which is why we have another doji candle.

Brent Crude Doji And Divergence

The Significance of Doji Candles

These doji candles generally indicate indecision in the markets, but when they occur at a possible high or low of a trading range and are close to key levels of support and resistance, they often provide good reversal signals, and that seems to be the case here.

Every time there has been a doji candle forming after a flirtation with the $80 level, the price has subsequently dropped and there has been a good opportunity to trade the downward breakout, ie when the price drops below the low of the doji candle the following day.

On each occasion the price has dropped enough to generate a decent profit before resuming it’s gradual upward trend once again, but there are signs that this upward trend is starting to run out of momentum.

RSI and Stochastic Divergence

As you can see from the daily chart of Brent Crude above, the price keeps on creeping higher, as indicated by the rising exponential moving averages, but the RSI and stochastic indicators are struggling to make new highs. In fact the peaks are actually getting lower each time.

So there is clear divergence on both of these indicators, which suggests that momentum is running out and as a result of this, there could be a significant reversal just around the corner. Therefore the 200-day exponential moving average, which currently stands at $72.51, may be a realistic target.

Trading Ideas

I will be watching the price of Brent Crude very closely when the markets open on Monday because it will be interesting to see where the price goes from here. There are potentially two scenarios that could create a high probability set-up:

  • The price drops below the low of the doji candle ($77.81), in which case it may be worth opening a short position a few pips below this level.
  • There is an inside bar whereby the trading range of the entire day (and maybe a few subsequent days) falls within the high and low of the doji, in which case it might be an idea to watch and wait until the price breaks below the low of the doji candle for an opportunity to go short.

If the price goes higher and breaks above the high of the doji candle, then it may finally breach the $80 level, in which case it might be worth opening a long position or forgetting about opening any trades altogether.

With divergence on the RSI and stochastic indicators, as well as a nice doji candle near the $80 level, a short position is looking a lot more appealing at the present time.

As always, I just want to point out that these are just my own thoughts and opinions. I am not recommending any trades whatsoever. You should always do your own research and make your own decisions when trading the financial markets.

Filed Under: Analysis Tagged With: brent crude, divergence, doji

Opening Range Breakout Trade on GBP/USD – 21 September 2018

September 21, 2018 by James Woolley Leave a Comment

Introduction

Opening range breakout trades can be some of the easiest and most profitable trades that you can make if you are a short-term day trader, particularly if you like to trade the main GBP and EUR pairs.

However this is not always the case. It all depends on the overnight trading range because the best set-ups will have a really narrow trading range (the smaller the better) because then there is much more potential for the price to move quite significantly when the markets open at around 8.00 AM local time.

In a perfect scenario, you will have a very small overnight trading range compared to the daily average true range (as indicated by the ATR indicator), and that’s exactly what we saw today with the GBP/USD pair.

GBP/USD Breakout Trade

It is only 9.30 AM in the UK at the time of writing this article, but the price has already moved enough to make a decent profit from this opening range breakout strategy.

GBPUSD Opening Range Breakout - 21 September 2018

In this example the overnight trading range of the GBP/USD pair was just 16.7 points between 00.00 and 7.00 AM, which is a fraction of the average daily trading range of 92.9 points.

Therefore when the price broke downwards out of this range just after 7.00 AM, this was a good opportunity to open a short position and trade the opening range breakout.

The best strategy is often to take a small profit when it presents itself with half your position, such as 10-20 points, for example, move your stop loss to break-even and then let the other half run for as long as possible, and this would have been a profitable strategy today.

As you can see from the chart above, the price has already moved more than 50 points from the closing price of the breakout candle (which is where most breakout traders would enter a position), and we are only a few hours into the trading session.

Closing Comments

The point of this article was simply to demonstrate how profitable it can be to trade opening range breakouts.

It’s not every day that you get the perfect set-up, even if you watch many of the major currency pairs, because the price will often have moved quite a lot already in the overnight session, but if you are patient enough to wait for the ideal set-ups when the overnight range is really small, you can potentially generate some excellent profits.

Filed Under: News Tagged With: breakout, gbpusd, opening range breakout

  • 1
  • 2
  • 3
  • Next Page »

Forex Rebates:

Choose from 40+ different forex brokers and crypto exchanges, and get cashback every time you trade:


Copy Profitable Traders:

If you join ZuluTrade, you can follow and subscribe to profitable traders and all of their trades will be automatically copied in your own trading account.

You can also earn money as a signal provider if you are already a profitable trader.

Click here to find out more

Recommended Broker:

Recent Blog Posts:

  • High Probability Trade on S&P 500 – 26 January 2024
  • Oanda Moves Into Prop Trading With Labs Trader Program
  • My eToro Performance in 2023 – Up 33.24%
  • The5ers Offering $20K Bootcamp Challenge For Just $1
  • Example of VWAP Bounce Trade on S&P 500 – 18 December 2023

Recent Articles:

VWAP Indicator
  • MA Sabres (LuxAlgo) Indicator
  • 10 Harsh Truths About Forex Trading
  • Best Websites for Monitoring Currency Strengths
  • Xmaster Formula Indicator for MT4 and MT5
  • Tools:

    Currency Heat Map

    Categories

    • Analysis
    • News

    Archives

    • January 2024
    • December 2023
    • November 2023
    • October 2023
    • September 2023
    • August 2023
    • July 2023
    • June 2023
    • May 2023
    • August 2020
    • June 2020
    • May 2020
    • April 2020
    • January 2020
    • December 2019
    • November 2019
    • October 2019
    • September 2019
    • August 2019
    • July 2019
    • June 2019
    • May 2019
    • April 2019
    • March 2019
    • February 2019
    • January 2019
    • December 2018
    • November 2018
    • October 2018
    • September 2018
    • August 2018
    • July 2018
    • June 2018
    • May 2018
    • March 2016
    • December 2015
    • November 2015
    • October 2015
    • August 2015
    • July 2015

    Disclaimer

    This website should be used for general information purposes only and in no way represents professional financial advice.

    Forex and CFD trading carries a high level of risk and it is possible to lose more than your initial deposit if using leveraged products.

    Copyright © 2025 · eleven40 Pro Theme on Genesis Framework · WordPress · Log in

    • About
    • Contact
    • Disclosure
    • Privacy Policy
    • Terms Of Service