The Forex Chronicles

  • Rebates
  • Brokers
  • News
  • Analysis
  • Signals
    • Best Copy / Social Trading Platforms
    • eToro Review
    • FXTM Invest Review
    • Marketclub Review
    • ZuluTrade Review
  • Indicators
  • Strategies
  • Articles

Archives for September 2018

ThePipsMasterUK Trader Profile

September 18, 2018 by James Woolley 3 Comments

Who is ThePipsMaster UK?

ThePipsMasterUK is a trader from the UK who has successfully become one of the most profitable signal providers on ZuluTrade in recent months.

This particular trader is currently ranked 10th on ZuluTrade (as of 18 September 2018) out of the thousands of signal providers that offer their services on this site, and currently has more than 4400 subscribers following them who have chosen to trade their signals automatically in their own accounts.

This is largely because they have an overall success rate of around 98%, and have generated a total profit of 2867 pips in the 26 weeks that they have been trading.

I’m sure you will agree that this is an exceptional trading record, which is why I wanted to profile them on this site and keep an eye on their results in the future to see if they can keep up this impressive record.

Therefore I have included this widget that automatically displays their overall trading statistics in real time, and has links that will enable you to open an account with ZuluTrade and follow their signals yourself if you so wish:

Trading Performance Update (March 2019)

I originally said below that I worry that this type of trading strategy isn’t really sustainable in the long run because when you are targeting small gains every day and using significantly larger stop losses, it only needs one bad call to wipe out months of profits, and unfortunately that’s exactly what has happened in recent weeks.

After opening overnight long positions on the EUR/USD pair on 4/5 February, the price never hit his modest price targets and after the EUR/USD started to fall, he and his copiers have had to anxiously wait for a reversal for the last month or so.

ThePipsMasterUK advocates a stop loss of 150 points, but when the price looked like it was going to take out these stop losses, he made the costly mistake of extending the stop loss to 250 points for each position (which is never a good idea), and after another price fall, he has now closed all of his trades for a huge loss of 1337.9 points.

As you can imagine, this has devastated the accounts of both him and his thousands of copiers, and many people have understandably stopped copying him, despite the fact that he is still over 3000 pips in profit overall.

However the problem is his money management rules because unless he can find a way to tighten his stop losses and still make money in the long run, these blowouts will inevitably occur again in the future.

Trading Strategy

The signal providers on ZuluTrade don’t provide full details of their trading strategies because they could easily be copied by other traders, but they do tend to provide a brief overview of their strategies, and in this case ThePipsMasterUK has revealed that he is using an overnight trading strategy on the EUR/USD pair.

So in other words, they focus exclusively on this one pair, which is good because it means that they know exactly how this particular behaves, and they only ever trade this pair overnight when the markets are quieter, volatility is reduced and the price movements are more predictable.

Profit Targets

If you take a closer look at their trading history, you will notice that this strategy looks for small gains from every trade, generally between 6 and 10 pips, with up to 8 positions opened at any one time. Therefore if the trades are successful, you could expect to make up to 80 pips profit per day following this trader.

Stop Losses / Drawdown

ThePipsMasterUK uses an arbitrary stop loss of around 150 pips, but this is largely to enable the trades to hit their target price without being stopped out for a small loss each time.

In reality these stop losses are never hit based on their previous track record, and the maximum drawdown so far has been 481.3 pips with a worst trade of 85.2 pips.

However the big worry for me is that when you are using large stop losses and are only targeting small gains with a high success rate, it only needs one bad trade to wipe out several months profit.

So far it hasn’t happened (it has now – see update above), but I have been in this game long enough to know that a big hit is inevitably going to happen at some point using this type of strategy.

Final Thoughts

Overall I have to applaud this trader, and am happy to see a fellow Brit achieve such impressive results in the 26 weeks that they have been trading, but I do worry that this type of strategy might not be sustainable in the long run.

ThePipsMasterUK has a remarkable 98% success rate, which is almost unheard of in the forex industry, but to maintain this kind of record over long periods of time is exceptionally hard to do, no matter how good your strategy is.

I myself don’t follow this particular trader and would probably worry about incurring a big hit every time the price moves 20-30 pips in the wrong direction, which seems to happen quite often, which is why I would probably feel more confident following ThePipsMasterUK if he tightened his stop losses and maybe lengthened his profit targets.

However he has said himself that he has no intention of changing his strategy, which is fair enough. I just hope that he can continue his success because I have seen many profitable providers crash and burn on ZuluTrade, and it would only need one or two bad trades for the same thing to happen here.
Filed Under: News Tagged With: signal providers, thepipsmasteruk, zulutrade

Potential Downward Breakout on AUD/NZD Pair Below 1.0870

September 17, 2018 by James Woolley Leave a Comment

AUD/NZD Price Action

The AUD/NZD pair is one that is not widely traded or followed by British, American and European traders (who make up the majority of my readers), but it is still one that is worth watching because it can throw up some decent trading opportunities from time to time.

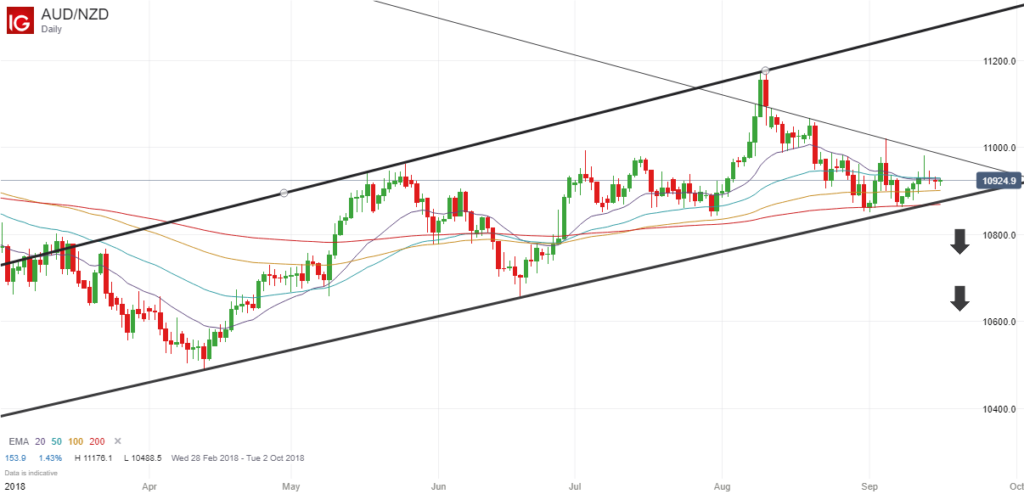
Having not looked at this pair for several days, I have just been looking at the recent price action, and it would appear that this pair has been slowly trending upwards in an ascending triangle pattern.

However in recent days it has been trading close to the lower trend line and is starting to show a little weakness with no real momentum to push higher.

Furthermore, the EMAs that I like to use, namely the 20, 50, 100 and 200-period exponential moving averages, are now very close to one another, which is exactly what we want to see before a big breakout.

AUDNZD Ascending Channel And EMA Breakout

Trading Opportunity

There is always the chance that the upward trend will continue and the price will move back up towards the upper trendline, but if the price does actually fall below 1.0870, it represents a much better trading opportunity in my opinion.

A downward break of the trendline, combined with an EMA breakout would be a good example of a high probability set-up and one that might be worth trading.

This is particularly true when you consider that if the price does fall below this lower trendline, it should close below the EMA (200), which the markets always pay close attention to, and will often act upon accordingly.

(Please note I am not recommending any trades. These are just my own personal thoughts and opinions).

Regarding price targets, you would have to say that if this scenario does play out, then the price of the AUD/NZD pair could easily fall to 1.0600, and if the 20, 50 and 100-period EMAs cross below the EMA (200), there could be enough momentum for the price to go a lot lower than this in the coming weeks and months.

With channel breakouts, you always want as many factors in your favour as possible, and in this case you will have the added weight of the EMAs breaking out of their consolidation and a downward cross of the EMA (200) if the price does indeed break out of its ascending channel and close below 1.0870. So this is potentially a decent set-up for anyone who is looking to take a position on this pair.

Filed Under: Analysis Tagged With: ascending channel, audnzd, breakout

$80 Acting As Strong Resistance For Brent Crude Oil

September 14, 2018 by James Woolley Leave a Comment

Brent Crude Price Action (2016-2018)

The price of Brent Crude dropped below $30 back in 2016, resulting in sharp share price falls for all of the listed oil companies.

Since then the price of Brent oil has risen steadily over time, and although it is nowhere near its all-time highs, it now stands at $78.18, which is a very strong recovery. As you might expect, the share price of all of the major oil companies has risen sharply as a result, and many oil traders have made some decent profits as well.

Recent Price Action

From a trading perspective, the long-term history of the Brent Crude oil price doesn’t matter too much, but if you look at how this commodity has traded in 2018, the price action is a lot more significant and could affect how you trade in the future.

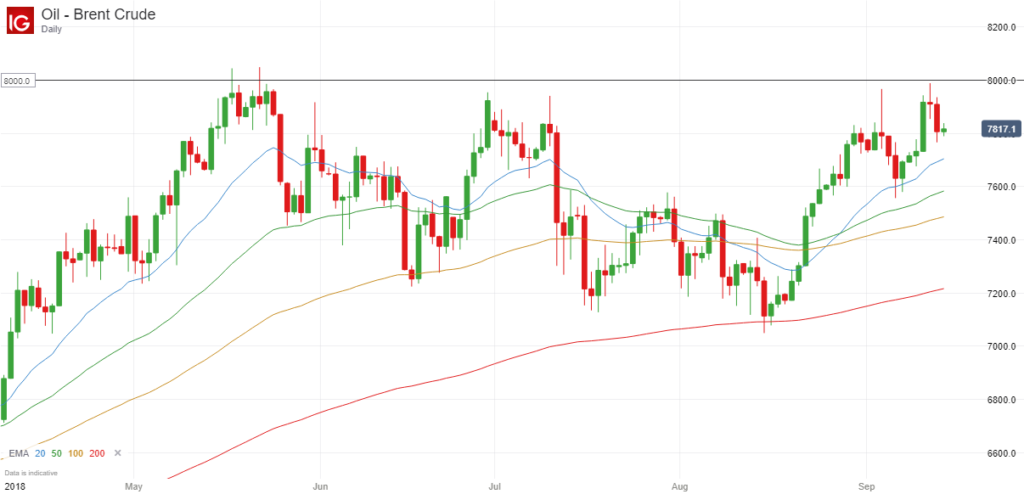
That’s because it is clear that $8000 has acted as strong resistance on several occasions since May, and continues to act as resistance even now in September 2018.

Brent Crude Oil Chart - September 2018

Just a few days ago the price hit a high of $79.89, but was quickly sold off shortly afterwards, and the daily candle ended up being a doji candle, which indicates indecision and a lack of momentum to take it higher.

Subsequently when the price dropped below the low of this doji candle the following day, this was a good opportunity to open a short position and trade the downward breakout.

Furthermore, on the rare occasions that the price has risen above $80, it has never actually closed above this level at any point.

The Significance of $80

Before I discuss possible trading opportunities, I just want to discuss the significance of round numbers once again.

There are some traders who don’t believe that these round numbers carry much weight, but in my experience these numbers are highly important and will often act as a strong support or resistance level.

As a result of this, you will often see the price reverse at these key levels, and this certainly seems to be the case here because this commodity is quickly sold off any time it gets close to this critical $80 level.

Trading Opportunities

One obvious way to trade this reoccurring trading pattern is to simply enter short positions at $80 or just below, such as $79.50 or $79.75, for example.

However I don’t necessarily like this plan because at some point the price is likely to break through this $80 level (and close above this level), which will encourage traders to go long and push the price higher, and trigger your stop loss.

A better approach is to pay attention to the candlesticks that form and try and trade the price action. For example, if there is a doji bar, like there was yesterday, you can enter short positions if the price drops below the low of this candle because this is a high probability trade that will often generate decent returns, particularly if you close half the position early for 30-50 points, for instance, move your stop loss to break even and let the other half run for as long as possible.

Similarly, if there is a large candlestick when the price gets close to $80, followed by at least two or three inside bars, you could wait for the price to close below the initial set-up bar before entering a new short position because this will signify that there is a downward breakout.

The point is that you should pay attention to these key levels of support and resistance because the markets will pay close attention to them and trade accordingly. Therefore the resulting price reversals can be both predictable and profitable to trade if you get the right set-ups.

Filed Under: Analysis Tagged With: brent crude, brent crude oil, resistance

Death Cross on Gold (Weekly Chart)

September 13, 2018 by James Woolley Leave a Comment

What is a Death Cross?

A death cross occurs when a short-term moving average crosses below a long-term moving average, and is significant because it often signals the start of a new long-term bearish trend.

Traders will often use different time periods and different moving averages to find these downward crossovers, such as the 50 and 100-period simple moving averages (SMAs), for example, but 50 and 200-period exponential moving averages (EMAs) seem to be the most popular.

As always, these crossovers are more significant on the longer time frames, such as the daily and weekly time frames, and for that reason I want to alert you to a new death cross that is occurring right now on the weekly gold chart based on the EMA (50) and EMA (200).

Previous Price Action

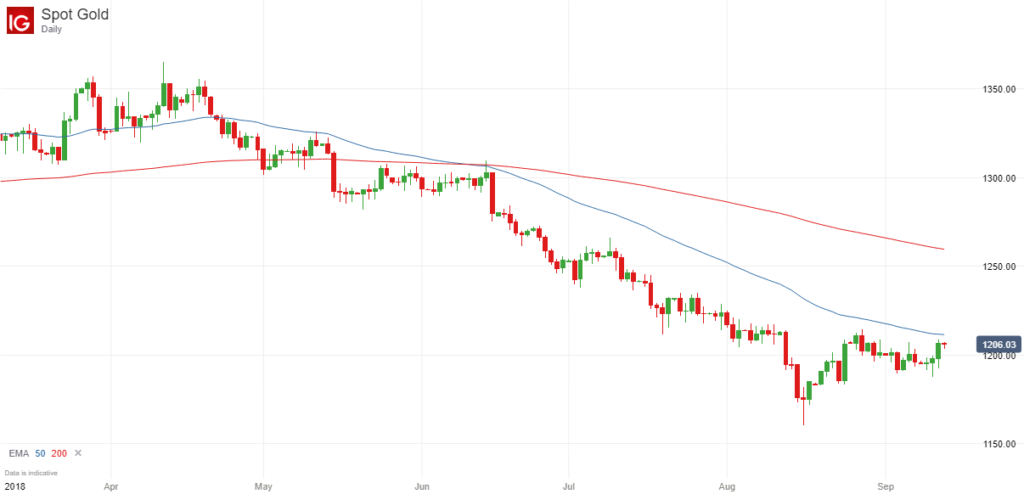
Gold traders may already be aware of the death cross that has occurred on the daily chart of this particular commodity during the summer. If not, here is the daily price chart that highlights this downward moving average crossover:

Gold Death Cross - Daily Chart

You can see that the death cross occurred during June and resulted in sustained price falls during the following months as traders continued to close long positions, sell gold and actively short this commodity, helping to drive the price down from around $1300 per ounce to just $1160 per ounce.

Since then the price has bounced back to the $1200 level and seems to have found support around this level, but ultra long-term traders may be interested to know that there is a new death cross forming on the weekly chart, which suggests that the price could still go a lot lower.

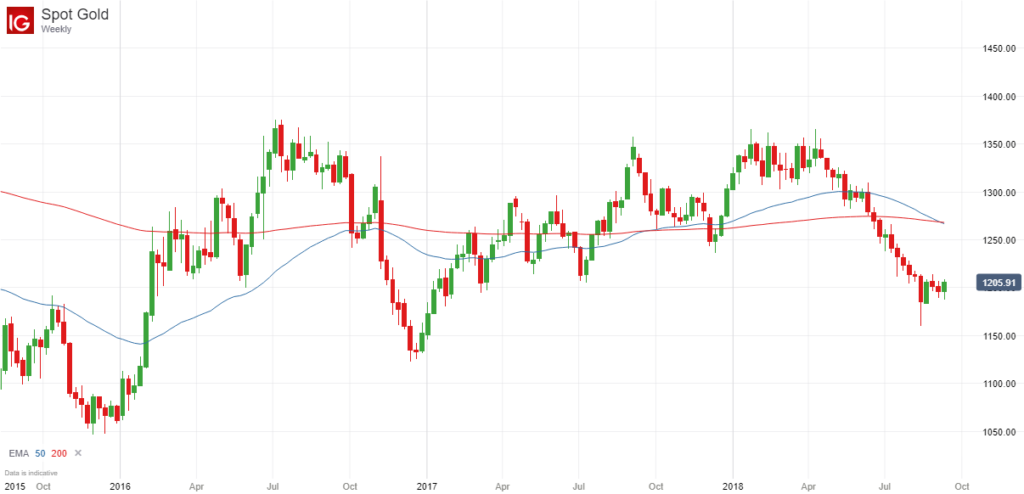
New Death Cross on Weekly Price Chart

If you look at the weekly price chart of gold, you can see that the 50-week exponential moving average is crossing below the 200-week exponential moving average.

Gold Death Cross - Weekly Chart

This in itself doesn’t necessarily guarantee that the price will drop a lot further in the short-term. It may well rebound in the next few weeks and come back to the EMA (200) because the price has already fallen heavily in recent months.

However the long term implications of this death cross could be significant because in the past these crossovers have resulted in some long and sustained price moves, both to the upside (in the case of a golden cross) and the downside.

Therefore it could be argued that the price of gold could potentially fall to $1000 or lower in the coming months if traders act upon this weekly death cross and continue to drive the price lower.

So it will be interesting to watch the price of gold over the course of the next few years to see if this is a significant death cross or whether the price continues to trade in a sideways range.

Trading Opportunities

I wouldn’t necessarily recommend that you actively trade these death crosses, particularly on the weekly time frame. Nevertheless they do present opportunities because you can take note of this long-term trend and look to open short positions on any pull-backs.

For example, when the death cross is in force on the weekly chart, you might want to wait for pull-backs on the daily price chart and look for opportunities to open short positions where appropriate (downward breakouts from peaks, heavily overbought conditions, strong resistance at round numbers etc).

(If you would like to trade gold, AAAFX and Ayondo are two brokers that generally offer low spreads on this commodity).

Filed Under: Analysis Tagged With: death cross, gold, gold price

Another Bitcoin Inside Bar Breakout For September 2018?

September 11, 2018 by James Woolley Leave a Comment

Previous Price Action

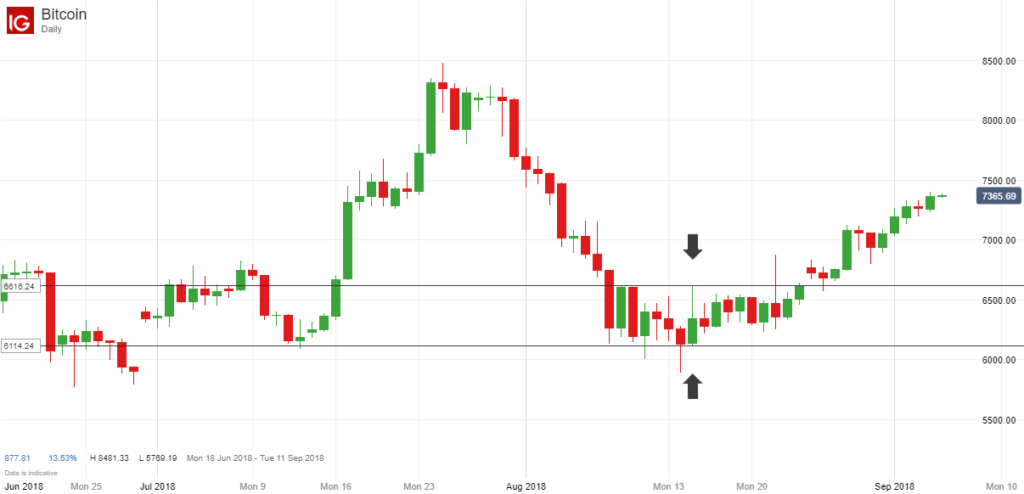
If you visit this site regularly, you will know from a previous post that there was a decent inside bar breakout that occurred on Bitcoin last month.

After trading in a sideways trading range for a considerable amount of time, there was an inside bar trading pattern whereby the price continued to trade within the range of the initial bar for several days, which reinforced my belief that it was only a matter of time before we saw a decent breakout, and that’s exactly what happened.

Bitcoin Inside Bar Breakout - August 2018

As I said previously, it wasn’t a perfect set-up because of the bearish breakout bar, but nevertheless you still could have generated up to 700 points profit by entering a long position at the closing price of the breakout candle.

Inside Bar Breakout Part II

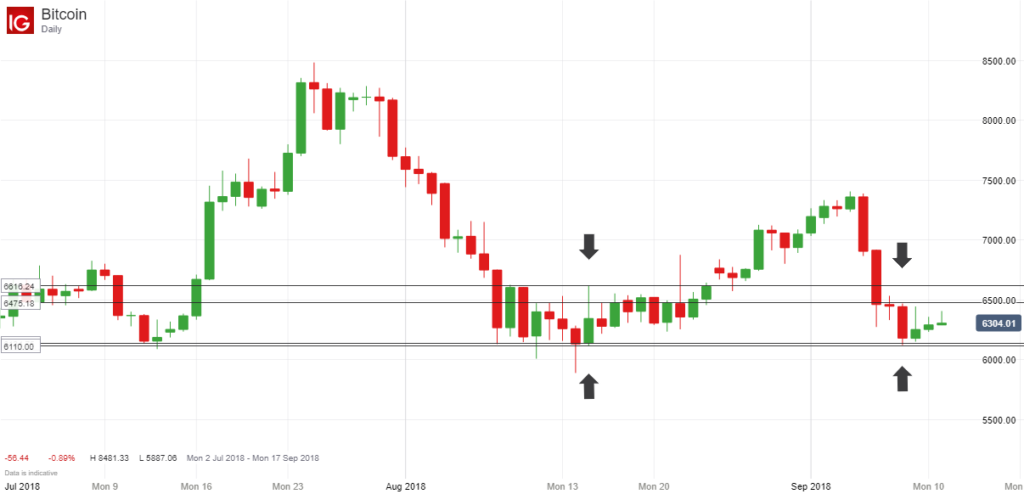
If you take a look at the right hand side of the chart below to view the very latest price action, you will notice that history appears to be repeating itself.

Bitcoin Inside Bar - September 2018

After surging upwards to a high of around $7400, the price of Bitcoin has since fallen sharply and is now trading within the range of the previous inside bar.

Furthermore, we now have a new inside bar set-up because at the time of writing, the price has been trading within the range of the initial bar for the last three days.

The set-up bars are indicated by the arrows in the chart above, and you can see that the following bars / candles are all inside bars, which is often a great set-up for a significant breakout.

Trading Opportunity

As a result of this, it may be worth watching the price of this popular cryptocurrency to see if there is a good opportunity to enter a new long or short position (depending on the direction of the breakout) in the coming days.

It may be profitable to simply enter a trade when the price breaks out of the range of the initial set-up bar (and closes outside of this range), but I personally would like to see the breakout bar close outside of the range of the previous inside bar trading range as well because I think this range still carries a lot of weight and is highly significant.

Anyway I just thought I would share with you this latest inside bar set-up because the subsequent breakouts that occur can be very profitable. As always, this is not a recommendation to trade, it is just my own personal thoughts and opinions. Please be aware that cryptocurrency trading is very risky, and there is the potential to lose a lot of money.

Filed Under: Analysis Tagged With: bitcoin, breakout, inside bar

  • « Previous Page
  • 1
  • 2
  • 3
  • Next Page »

Forex Rebates:

Choose from 40+ different forex brokers and crypto exchanges, and get cashback every time you trade:


Copy Profitable Traders:

If you join ZuluTrade, you can follow and subscribe to profitable traders and all of their trades will be automatically copied in your own trading account.

You can also earn money as a signal provider if you are already a profitable trader.

Click here to find out more

Recommended Broker:

Recent Blog Posts:

  • High Probability Trade on S&P 500 – 26 January 2024
  • Oanda Moves Into Prop Trading With Labs Trader Program
  • My eToro Performance in 2023 – Up 33.24%
  • The5ers Offering $20K Bootcamp Challenge For Just $1
  • Example of VWAP Bounce Trade on S&P 500 – 18 December 2023

Recent Articles:

VWAP Indicator
  • MA Sabres (LuxAlgo) Indicator
  • 10 Harsh Truths About Forex Trading
  • Best Websites for Monitoring Currency Strengths
  • Xmaster Formula Indicator for MT4 and MT5
  • Tools:

    Currency Heat Map

    Categories

    • Analysis
    • News

    Archives

    • January 2024
    • December 2023
    • November 2023
    • October 2023
    • September 2023
    • August 2023
    • July 2023
    • June 2023
    • May 2023
    • August 2020
    • June 2020
    • May 2020
    • April 2020
    • January 2020
    • December 2019
    • November 2019
    • October 2019
    • September 2019
    • August 2019
    • July 2019
    • June 2019
    • May 2019
    • April 2019
    • March 2019
    • February 2019
    • January 2019
    • December 2018
    • November 2018
    • October 2018
    • September 2018
    • August 2018
    • July 2018
    • June 2018
    • May 2018
    • March 2016
    • December 2015
    • November 2015
    • October 2015
    • August 2015
    • July 2015

    Disclaimer

    This website should be used for general information purposes only and in no way represents professional financial advice.

    Forex and CFD trading carries a high level of risk and it is possible to lose more than your initial deposit if using leveraged products.

    Copyright © 2025 · eleven40 Pro Theme on Genesis Framework · WordPress · Log in

    • About
    • Contact
    • Disclosure
    • Privacy Policy
    • Terms Of Service