The Forex Chronicles

  • Rebates
  • Brokers
  • News
  • Analysis
  • Signals
    • Best Copy / Social Trading Platforms
    • eToro Review
    • FXTM Invest Review
    • Marketclub Review
    • ZuluTrade Review
  • Indicators
  • Strategies
  • Articles

Archives for October 2018

Aimstrader (Jeroen Dekker) Trader Profile

October 30, 2018 by James Woolley Leave a Comment

Who is Aimstrader?

Aimstrader is a trader from the Netherlands called Jeroen Dekker who has rapidly made quite a name for himself on the eToro social trading platform throughout 2018.

At a time when many traders on eToro have struggled to make any profits, particularly after the heavy stock market falls that we have seen this month and the fall in cryptocurrency prices that have continued throughout 2018, Aimstrader has continued to generate consistent profits every month.

Markets Traded

One of the reasons why Jeroen has avoided any heavy losses and outperformed many other traders on eToro is because he doesn’t actually trade or invest in shares, and avoids trading cryptocurrencies. He is purely an index trader.

He seems to trade the German DAX 40 index the most (45.5% of his trades), but he also likes to trade the Nasdaq (22%), the Dow Jones (7.5%) and the French CAC40, and most of his trades are closed within 4 hours on average. So he could be classified as a short-term trader or day trader.

Trading Performance

Aimstrader has been trading since February 2018, and at the time of writing (30 October 2018), his results are still very impressive.

Jeroen Dekker AimsTrader Stats – eToro

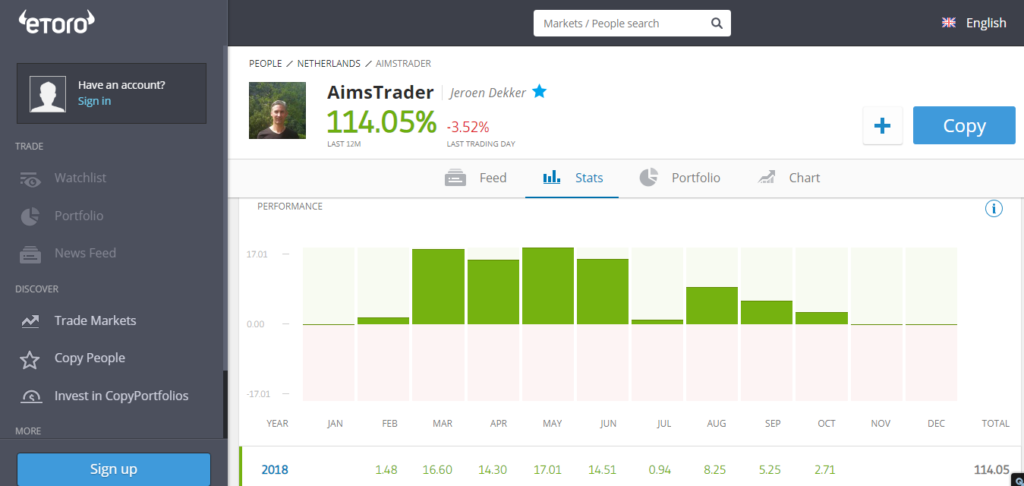
As you can see from the screenshot above, he hasn’t yet had a losing month since he first started trading, and has generated a total profit of 114.05% so far, with the best month being May where he generated a profit of just over 17%.

After a superb 4-month run, the results haven’t been quite as impressive since July, but he has still managed to make some decent profits every month.

Furthermore, when you look at his overall success rate, it is hard to find fault because out of 532 trades, he has a win ratio of 87.22%.

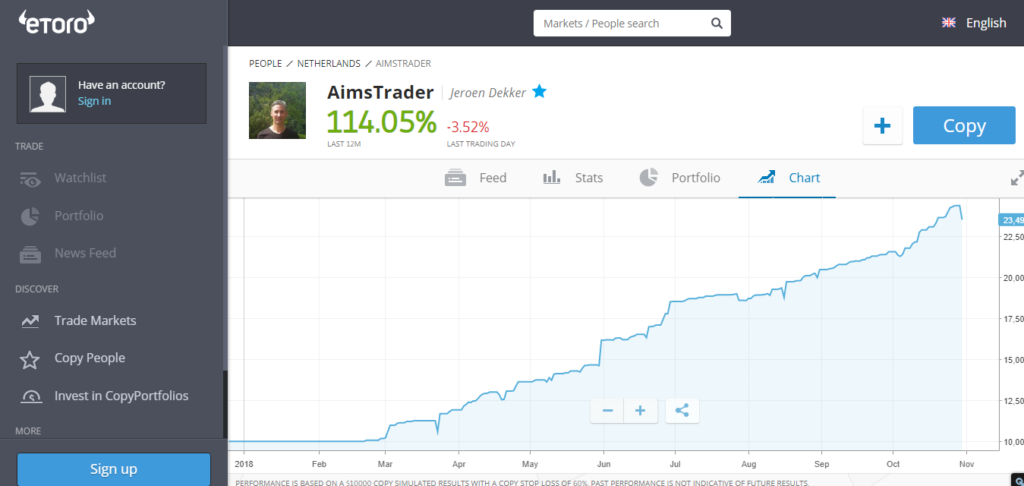
If you look at the chart of his performance, you will see that Jeroen Dekker doesn’t seem to have periods of heavy drawdown either, like some of the traders on this platform, which is why he has a reasonable risk score of 4 right now.

Jeroen Dekker Aimstrader Performance Chart

Past performance is not indicative of future results.

Trading Performance Update (December 2018)

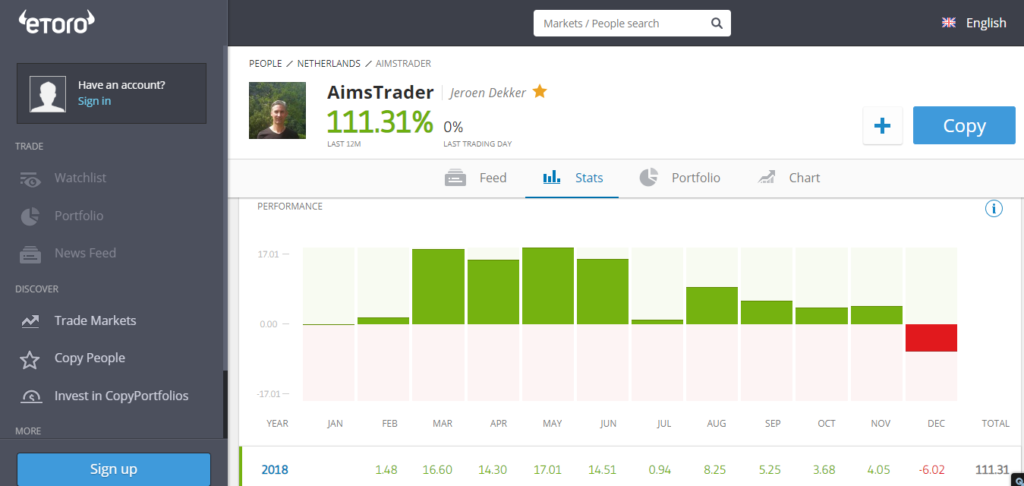
December has been a terrible month for many of the traders and investors on eToro (including myself), and Aimstrader has also had an unusually poor month as well.

After admitting that he deviated from his usual day trading strategy at times, he is currently down 6.02% in December at the time of writing, and the reason why is because he has continued to open long positions on the major indices, which haven”t always reversed as the markets have continued to fall sharply.

As a result of this poor performance, Aimstrader has lost 10% of his copiers in the last 7 days alone, but overall it has still been a very profitable year for this popular trader because he is still up 111.31% this year, and I’m sure he will get things back on track in 2019.

Jeroen Dekker AimsTrader Stats – December 2018

Trading Performance Update (February 2019)

I mentioned in my previous update that Aimstrader had a bad month in December, and unfortunately his losing streak seems to have continued into 2019.

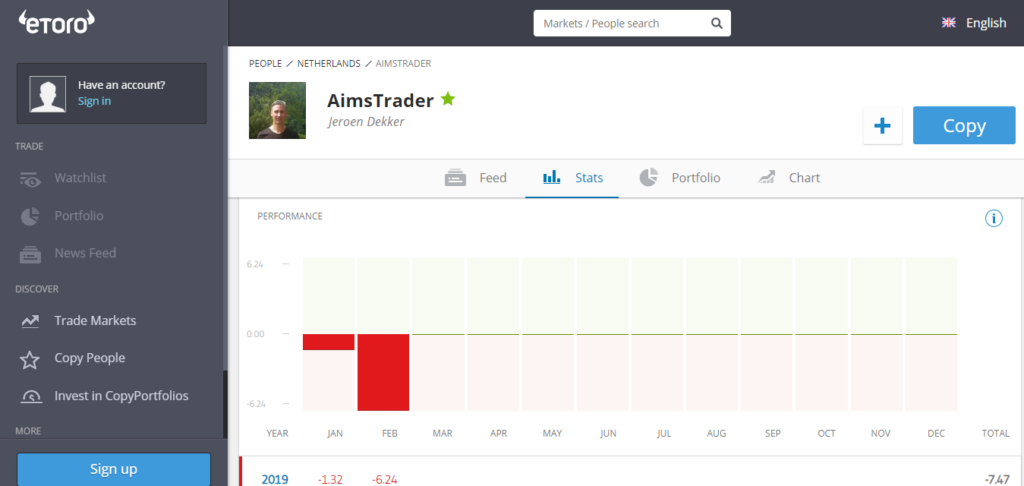
After ending December down 4.21%, he had a mediocre but generally acceptable January with a loss of 1.32%, but it is February that has resulted in big losses for many copiers, and encouraged many people to stop actively copying him.

That’s because at the time of writing (22 February 2019) he is currently down 6.24% for the month after some disastrous trades on the CAC40.

Aimstrader attempted to call a possible reversal on the CAC40 with a series of five short positions, but he was forced to close them all out for losses of between 22.33% and 42.98% as the markets just kept on going up.

Subsequently, he is now down approximately 11.73% in the last three months alone, which has resulted in many copiers incurring some heavy losses because he attracted many new copiers during this time.

Aimstrader Performance Stats - February 2019

Trading Strategy

As mentioned above, Aimstrader is very much a short-term trader because each trade lasts around 4 hours on average, and he tends to place an average of 14-15 trades per week.

Although he doesn’t reveal any details about his trading strategy, he points out in his profile that he has years of experience as a trader and aims to make a profit of at least 50% per year, with consistent profits every week and every month.

He also says that his trading method is based on a combination of fundamental and technical analysis, and although he may sometimes place several trades per day, he doesn’t necessarily trade every day if there are no decent trading opportunities.

Copiers

Jeroen Dekker, aka Aimstrader, is still one of the most popular traders to follow on eToro, with 24,906 followers and 4078 people actively copying his signals, with over $5m invested in him.

Final Thoughts

Aimstrader is a standout trader right now at a time when many of the leading traders on eToro have lost money, but he has only been trading for about a year.

So we will have to wait and see if he can continue to deliver equally good results in the months and years to come.

If you would like to keep an eye on this trader, you might want to bookmark this page or follow him on eToro, and if you are confident in his abilities, you can of course choose to invest money with this trader, but please read the disclaimer below before doing so.

Past performance is not an indication of future results. This content is for information and educational purposes only and should not be considered investment advice nor portfolio management. 81% of retail investor accounts lose money when trading CFDs with this provider.

Filed Under: News Tagged With: aimstrader, etoro, jeroen dekker

GBP/USD Analysis – The Importance of the EMA (200)

October 26, 2018 by James Woolley Leave a Comment

Introduction to the EMA (200)

The 200-day exponential moving average, or EMA (200) for short, actually has a lot of importance in the world of trading.

When the price breaks upwards through the EMA, it is often a sign of strength, but more significantly, when the EMA (50) crosses upwards through the EMA (200), it is a much stronger signal to go long.

Similarly, when the EMA (50) crosses below the EMA (200), it is referred to as a death cross, and gives a strong signal to go short.

However it is important to note that the EMA (200) is often a key support or resistance level, whereby the price will touch this line, before reversing in the opposite direction.

Many people are sceptical about the importance of such indicators, but you only need to look at the daily chart of the GBP/USD pair to see how the price reacted when it touched the 200-day moving average:

GBPUSD EMA (200) Resistance - October 2018

GBP/USD Sell-Off

The red line indicates the EMA (200) in the chart above, and you can see that the price touched this key indicator on four separate days, and came close to it on one other day as well, but on every occasion the pair was met with a wave of selling that drove the price back below this indicator.

Similarly, this indicator will have acted as a target price to take profits for any people who were long on this pair, so this too would have helped force the price down.

Final Thoughts

The point I want to make is that this 200-day exponential moving average is always worth including on your daily price charts because it is a good place to take profits, and is a good level to watch because it often acts as a key support or resistance level.

Similarly if the price goes straight through it and the EMA (50) later crosses through it as well, it is often seen as a very strong signal that a new trend has emerged. Therefore you should consider looking for opportunities to get in on this trend at a good price when this occurs.

Filed Under: Analysis Tagged With: gbpusd, resistance, support

Bearish Signals For US Stock Markets – October 2018

October 23, 2018 by James Woolley Leave a Comment

Previous Price Action

I think many traders were shocked by the severity of the mini-crash that occurred recently on the US stock markets because it seemed to come out of nowhere, even though many traders and investors have been expecting some kind of pull-back for quite a while now.

Since then there hasn’t really been a continuation of the sell-off because the price seems to have consolidated around the 200-day exponential moving average of both the S&P 500 and the Dow Jones.

However after a brief reversal, it is clear that there is not enough momentum to take it back to its previous highs, and worse still, the price action of the previous two trading sessions paints a bleak picture.

On both occasions the price traded a lot higher during the day, but ended up falling back and closing close to its opening price, which is a very bearish sign.

Furthermore, the futures prices of both of these markets are currently suggesting that the price is set to open a lot lower later today.

S&P 500 Price Weakness - October 2018

Dow Jones Price Weakness - October 2018

Future Direction

It is generally a bad idea to make predictions, particularly if you are backing your predictions with your own money, but the signs are not good if you are hoping for a recovery.

The two bearish pin bars and what is looking like a significantly lower opening later today is going to take the price further away from the EMA (200), and we have already seen the EMA (20) cross below the EMA (50), which is obviously another bearish signal.

I think the key thing to look for here is to see if the price can break below the previous lows on both the S&P 500 and the Dow Jones, which currently stand at 2709 and 24896 respectively.

If this happens, and the price actually closes below these lows, then there is a high probability that the price will go a lot lower.

Even if the price consolidates below the EMA (200) in the next few trading sessions, there is the potential for the dreaded death cross to occur, where the EMA (50) crosses below the EMA (200).

This would attract a lot of headlines in the financial media, and would almost become self-fulfulling because these negative headlines by themselves often encourage people to sell their shares and force the markets lower.

So while there is always the possibility of a consolidation or even a reversal, the markets are looking very weak right now, and if the price breaks below the recent lows, there could be a much bigger sell-off.

Filed Under: Analysis Tagged With: dow jones, s&p500

Why It Is Almost Impossible To Day Trade Bitcoin

October 19, 2018 by James Woolley Leave a Comment

Popularity of Bitcoin

Bitcoin ImageCryptocurrencies such as Ripple, Litecoin, Ethereum and Dash are continually being mentioned on the various different financial news channels and websites , but it is fair to say that Bitcoin is still the most well-known of these cryptocurrencies, and the most talked about.

Many people have chosen to actively buy some Bitcoin coins in the last five years or so and hold on to them as a long-term investment, but others now prefer to trade the price movements of Bitcoin over the course of several days or weeks via CFDs because they can open long positions and short positions.

However while it is true that many brokers now offer CFDs for Bitcoin and many of the other popular cryptocurrencies, it is worth pointing out that these markets are still not really suitable for day trading.

Here are some of the reasons why:

Low Average Daily Trading Range

There was a time at the end of 2017 and the beginning of 2018 when the price of Bitcoin used to fluctuate by around 1500-1900 points a day, but volatility has been steadily declining throughout 2018, and the average daily trading range is now just 208 points.

Therefore this makes it very difficult to make money from if you are just looking to hold on to a position for no more than a few hours, and don’t want to hold any overnight positions.

It is hard enough to predict where the price is heading in the next few weeks or months, but it is even harder trying to correctly predict the direction of the price on any given day.

Large Spreads

Following on from the last point, even if you were able to correctly predict the price direction of Bitcoin on a daily basis, the large spreads would massively eat into your profits.

As stated above, the average daily trading range is currently just over 200 points. So when you bear in mind that many of the leading CFD brokers have spreads of between 50 and 150 points, it is practically impossible to consistently make money from short-term day trades.

Easy Markets have spreads from 45 points on Bitcoin, which is very reasonable, but this still isn’t low enough to make Bitcoin a viable day trading instrument.

Large Margin Requirements

There is one other factor that restricts the ability for traders to day trade Bitcoin, and that’s the large margin requirements.

Many brokers require greater margin for cryptocurrencies than other markets because they are viewed as being a lot more risky, and this is particularly the case for Europe-based traders because the new ESMA rules require a margin of at least 50% when trading cryptos.

Final Thoughts

As you can see, there are many reasons why Bitcoin is not really suitable for day traders at the present time.

The large spreads and the large margin requirements, combined with the low average trading range make this virtually impossible to make money from right now.

Therefore if you are someone who is looking to trade Bitcoin, you should take a longer term view and be prepared to hold on to your positions for days, weeks or months at a time because then these factors will be less of an issue, even if you have to pay a small daily financing charge for holding long positions overnight.

If you open a long position and the price of Bitcoin goes up by $500 or $1000 one week later, then a $50 spread won’t eat into your profits too much, and the daily financing charges will be relatively small.

Over time the spreads may start to come down, and there is a possibility that the ESMA may lower their margin requirements for European traders. However until that happens, it is probably better to look for breakouts or price reversals, for example, and wait for the big price moves to occur, which are obviously more likely to occur over the course of several days rather than a few hours.

Filed Under: News Tagged With: bitcoin, cryptocurrencies, day trading

Possible Breakout on the EUR/JPY Pair – October 2018

October 17, 2018 by James Woolley Leave a Comment

Breakout Criteria

There are various factors that I will consider when looking for potential breakout trades, but one of my favorite patterns is when you get a combination of a moving average cluster and a sideways trading range.

In other words, I like to see the 20, 50, 100 and 200-period exponential moving averages all trading close together because this indicates a period of consolidation and indecision, and is often the pre-cursor to a big breakout.

Similarly, I like to see the price trading in a consistent trading range close to these moving averages because this makes it easier to detect a breakout, and gives you a natural entry point because you just enter a long position when the price closes above this range or a short position when the price closes below this range.

I have just found that both of these criteria are present on the daily chart of the EUR/JPY pair, so this could potentially develop into a good trading opportunity:

EURJPY Potential Breakout - October 2018

Trading Opportunity

What I like about this set-up is that the trading range is currently very narrow, which is always a good thing because you can potentially make more profits, and can make your stop losses smaller if you place them just outside this range.

The only real danger is that you sometimes get a few false breakouts before the big one, which could happen here, but there is still the potential for the price to move at least 200 points in either direction.

A breakout to the upside could see the price retest its highs from last month at around 133.00, with 132.00 as a first target and potentially a price to close half the position and move the stop loss up to break-even.

A breakout to the downside, meanwhile, would see 128.00 as the first target because this was a recent support level, and if the price breaks through this level, then 126.00 could easily be attained.

It should always be pointed out that breakouts are not always profitable because you sometimes get false moves, and I am not certainly not recommending any trades. These are just my own thoughts and opinions.

The key to success with any strategy is to keep your losing trades small, and let your winning trades run, and this applies to breakout strategies as well.

Filed Under: Analysis Tagged With: breakout, eurjpy

  • 1
  • 2
  • 3
  • Next Page »

Forex Rebates:

Choose from 40+ different forex brokers and crypto exchanges, and get cashback every time you trade:


Copy Profitable Traders:

If you join ZuluTrade, you can follow and subscribe to profitable traders and all of their trades will be automatically copied in your own trading account.

You can also earn money as a signal provider if you are already a profitable trader.

Click here to find out more

Recommended Broker:

Recent Blog Posts:

  • High Probability Trade on S&P 500 – 26 January 2024
  • Oanda Moves Into Prop Trading With Labs Trader Program
  • My eToro Performance in 2023 – Up 33.24%
  • The5ers Offering $20K Bootcamp Challenge For Just $1
  • Example of VWAP Bounce Trade on S&P 500 – 18 December 2023

Recent Articles:

VWAP Indicator
  • MA Sabres (LuxAlgo) Indicator
  • 10 Harsh Truths About Forex Trading
  • Best Websites for Monitoring Currency Strengths
  • Xmaster Formula Indicator for MT4 and MT5
  • Tools:

    Currency Heat Map

    Categories

    • Analysis
    • News

    Archives

    • January 2024
    • December 2023
    • November 2023
    • October 2023
    • September 2023
    • August 2023
    • July 2023
    • June 2023
    • May 2023
    • August 2020
    • June 2020
    • May 2020
    • April 2020
    • January 2020
    • December 2019
    • November 2019
    • October 2019
    • September 2019
    • August 2019
    • July 2019
    • June 2019
    • May 2019
    • April 2019
    • March 2019
    • February 2019
    • January 2019
    • December 2018
    • November 2018
    • October 2018
    • September 2018
    • August 2018
    • July 2018
    • June 2018
    • May 2018
    • March 2016
    • December 2015
    • November 2015
    • October 2015
    • August 2015
    • July 2015

    Disclaimer

    This website should be used for general information purposes only and in no way represents professional financial advice.

    Forex and CFD trading carries a high level of risk and it is possible to lose more than your initial deposit if using leveraged products.

    Copyright © 2025 · eleven40 Pro Theme on Genesis Framework · WordPress · Log in

    • About
    • Contact
    • Disclosure
    • Privacy Policy
    • Terms Of Service