The Forex Chronicles

  • Rebates
  • Brokers
  • News
  • Analysis
  • Signals
    • Best Copy / Social Trading Platforms
    • eToro Review
    • FXTM Invest Review
    • Marketclub Review
    • ZuluTrade Review
  • Indicators
  • Strategies
  • Articles

Archives for October 2018

Gold Price Breakout – October 2018

October 15, 2018 by James Woolley Leave a Comment

Previous Price Action

The price of gold has been trading in a sideways trading range for the last few months, struggling to break decisively above or below the $1200 level.

This can be seen in the chart below because you can see that the price has been trending within the upper and lower trendlines for many weeks now.

Gold Breakout - October 2018

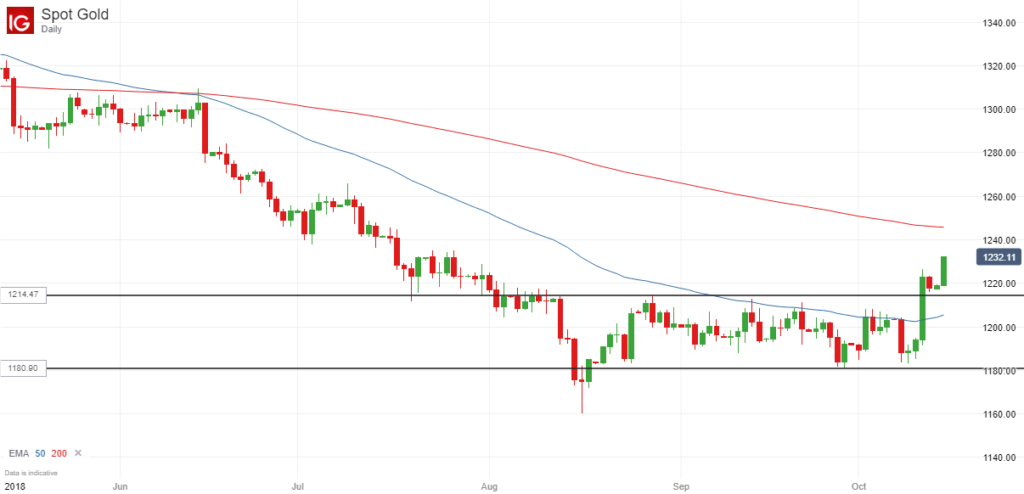
It seemed that there needed to be a catalyst to move the price strongly upwards or downwards to break out of this range, and last week’s stock market mini-crash provided this catalyst.

Safe Haven

In times of uncertainty, people often sell some of their stocks to preserve their capital and invest it into something a little safer and less risky, and gold is often seen as a perfect safe haven for this cash.

Therefore it was no surprise at all that the price of gold surged higher last week after the big sell-off because this happens fairly regularly.

As a result of this increased buying, the price of gold broke upwards out of this trading range, and is currently trading at $1232 at the time of writing.

Trading Opportunity

If you are someone who likes to trade price breakouts, you probably would have entered a long position at the close of the breakout candle, and would now be in profit slightly because the price has continued edging higher at the start of the London session.

Indeed the breakout candle closed at $1223, so this breakout trade is already $9 in profit at the time of writing.

I myself didn’t really like the look of this breakout because there was a very large breakout candle, and when this happens you will often get quite a large pull-back, and are then sitting on a loss, and sometimes the breakout quickly runs out of momentum.

Furthermore, I thought that there may be limited upside from here because the EMA (200) currently stands at $1245, which is likely to act as a strong resistance level.

There are some breakouts that look ripe for a trade, and others that are a little unconvincing, and I would say that this latest gold breakout is still a little unconvincing, which is why I will not be trading this breakout at any point, even after it broke higher today.

The reason why I say that is because we have already seen a slight recovery in the stock market, and there seems to be a little support right now that is holding the price of the major US markets up.

So if the markets do happen to bounce back this week, which could happen, this will likely have the opposite effect on gold, and the price may well fall back within in the previous trading range.

This has turned out to be a good breakout trade for those that had the courage to trade it, particularly if they have already moved their stop loss up to break-even because it is now a risk-free trade, but I never really felt that this was a high probability set-up.

I am prepared to wait for high probability set-ups where the odds of success are much higher. The price of gold could easily touch the EMA (200) and possibly break through it, but it’s no problem at all if this occurs. It’s just something you have to accept as a trader.

Filed Under: News Tagged With: breakout, gold

US Markets Crash – 200-Day Moving Averages Breached Already

October 11, 2018 by James Woolley Leave a Comment

Is the Bull Run Over?

There is no doubt that the US stock markets have had a fantastic run since they hit their lows back in 2008 and 2009 after the financial banking crisis.

The Dow Jones has gone from 6500 to around 27000 earlier this year, and the S&P 500 has posted similar gains, rising from around 670 to around 2940.

Indeed this has helped global stock markets soar higher in recent years, which has resulted in many active and passive investors growing their portfolios quite substantially.

However yesterday’s big sell off, triggered in part by the threat of rapidly rising interest rates, could signal that the bull run is finally over.

Yesterday’s Sell-Off

The fact is that many US companies had become seriously overvalued due to continued share price rises, and this was even more true for many of the top technology companies.

So my own personal view is that yesterday’s sell-off, which saw 800+ points wiped off the Dow Jones, has been a long time coming, and is actually quite healthy in many respects, even if it has negatively affected my own portfolio of UK stocks.

Now we just need to wait and see if this is a short-term correction or the start of a long-term correction, but using the 200-day moving averages as a guide, the future is looking ominous.

200-Day Moving Averages

The big price rises had seen the price of the major US stock indices continue to trade far higher than the 200-day moving average of these indices, but yesterday’s falls have already seen the price come back to trade close to this key support level in both instances.

Here is the daily chart of the Dow Jones…

Dow Jones Chart After October Sell-Off

….and here is the daily chart of the S&P 500…

S&P 500 Chart After October Sell-Off

As you can see, with the futures once again trading lower today, the price has actually dipped below the 200-day exponential moving average on the S&P 500 at the time of writing.

Future Price Direction

A fall below the 200-day moving average isn’t enough to signal the start of a new bear market, so it is still far too early to call.

However if the price continues to trade below this critical level for the next few weeks, the shorter-term EMA (50) will eventually cross below the EMA (200), triggering a death cross, and this would be a much stronger signal that we are seeing the start of a new bear market.

Therefore there is the potential for the Dow Jones to test the previous low of 2018 – 23112 – and for the S&P 500 to test the previous low of 2553 at the very least.

Whatever happens, these are interesting times whether you are a trader or investor, and it is going to be very interesting to see where the price of these major US indices go from here.

Filed Under: News Tagged With: dow jones, s&p500

Possible Pennant Breakout for GBP/JPY Pair in October 2018

October 10, 2018 by James Woolley Leave a Comment

Brexit Weighing Heavily on GBP Pairs

The GBP pairs continues to be heavily influenced by Brexit, which obviously makes them difficult to trade because one piece of positive or negative news can result in huge price movements in either direction.

Therefore if you do want to trade these pairs, it is probably best to concentrate solely on technical analysis, use strict stop losses to hopefully avoid any major wipeouts and be aware of when any Brexit negotiations or speeches are taking place.

With this in mind, one of the most interesting looking pairs right now is the GBP/JPY pair because after trending upwards for the last few months, we have seen some indecisiveness in recent weeks and a pennant has formed on the daily price chart:

GBPJPY Pennant - October 2018

Pennant Breakout?

Pennant breakouts can be very profitable to trade because many traders will spot the same pattern and will trade the subsequent breakout, and so it might be worth watching for a possible breakout on the GBP/JPY pair.

A breakout to the upside would see a resumption of the previous uptrend, and if the price could close strongly above the 150.00 level, which is a major round number and a big psychological resistance level, there is the potential for the price to move higher and test the next resistance level at 154.00, which is a previous high from April.

A breakout to the downside would see a resumption of the long-term downward trend that has been present throughout 2018, and we could potentially see a much stronger price move.

Using fibonacci retracement levels as a guide, a 50% retracement of the previous upward trend would give a price target of 144.81, whilst a 61.8% or 100% retracement would give price targets of 143.65 and 140.00 respectively.

Alternatively, another popular strategy to use when trading pennant breakouts is to derive your target prices from the width of the pennant (from the high to the low).

So regardless of the direction of the breakout, your exit price would be equivalent to the width of the pennant, which in this case is around 315 points, or 2 x the width of the pennant if you are confident of a big move, which would be around 630 points.

Final Thoughts

As always, I am not recommending any trades or offering any signals. These are just my own personal thoughts and opinions.

I just want to highlight a pennant that has formed on the GBP/JPY pair and discuss pennant breakouts in general because these can be very profitable when you get the right set-up.

Furthermore, although not all of these subsequent breakouts turn out to be profitable, there is the potential for a big price move in this instance because any major Brexit news could be the catalyst that causes the price to break strongly out of its narrow trading range.

Filed Under: Analysis Tagged With: breakout, gbpjpy, pennant

Is Forex Trading Being Overshadowed by Cryptos and Cannabis?

October 8, 2018 by James Woolley Leave a Comment

Popularity of Cryptocurrencies in 2017

Bitcoin, Ethereum, Litecoin, Ripple and many other cryptocurrencies really exploded in popularity in 2017 as the price of these instruments continued to rocket higher and higher, making thousands of people extremely rich in the process.

In some respects it was a new gold rush because many ordinary people started taking an interest in these cryptocurrencies and buying a few Bitcoins to grab a slice of the pie.

However, as expected, the price of Bitcoin and other markets couldn’t keep on going up forever, and eventually there was a huge price drop across the board, which has left many people nursing some heavy losses and praying for a recovery.

Despite these price falls, these cryptocurrencies are still very popular with speculators and traders, and are still be talked about on financial blogs, websites and TV channels on a daily basis.

Cannabis Stocks and ETFs

With the legalisation of cannabis in Canada, and a potential relaxation of laws in other countries around the world, there has also been a huge rush to buy shares in companies that are involved in the cannabis industry.

ETFs have been set up that invest in a selection of companies in this growing sector so that individuals can get a broad exposure to this industry without having to select individual companies, and the price of these ETFs has really rocketed higher in the last few months.

Two of the most popular ones are the Horizons Medical Marijuana Life Sciences ETF (HMMJ) and the ETFMG Alternative Harvest ETF (MJ), and you can see from their respective charts below that they have both risen by more than 50% since August:

Horizons Medical Marijuana Life Sciences ETF

ETFMG Alternative Harvest ETF

As a result of these price moves and the increased media coverage, more and more traders and investors are taking in interest in these cannabis stocks and ETFs because of the enormous potential to make future profits from the opening up of this industry.

Indeed as interest in cryptocurrencies has started to wane in 2018 with less volatility and fewer wild price swings, it is the cannabis / marijuana stocks that have become the ‘next big thing’ this year.

Implications for the Forex Trading Industry

I think it is fair to say that forex trading has definitely been overshadowed by both cryptocurrencies and cannabis stocks in the last couple of years.

While it is true that there will always be a large forex industry with many participants from all over the world, there is no doubt that traders are increasingly looking to these alternative markets in the belief that they can potentially generate more profits in the long run.

Subsequently, forex brokers are desperately looking to capitalise on these trends and compensate for any reduction in forex trading activity by their traders.

Therefore you will see that many brokers now offer trading on Bitcoin and a few other cryptocurrencies in the form of CFDs, and have created a range of banners and promotional material that is designed to attract these cryptocurrency traders.

Similarly, I am also seeing a range of banners for cannabis ETFs from brokers who provide the option to buy or trade these markets.

So, if anything, the clever brokers are actually benefiting from the growing popularity of cannabis stocks and cryptos, even if their forex trading profits have flat-lined or are growing at a slower rate.

It is also good news if you are an individual trader because you now have more markets to potentially make money from with the ability to trade these cannabis stocks and ETFs, and more opportunities to benefit from the price volatility of cryptocurrencies because you can take long and short positions, and don’t actually have to buy the cryptos directly.

Filed Under: News Tagged With: cannabis, cryptocurrencies, forex

EUR/USD Analysis – The Power of Pin Bars and Inside Bars

October 5, 2018 by James Woolley Leave a Comment

Introduction

The EUR/USD pair traded in a sideways trading range for much of the summer, but suddenly burst into life in August when the price broke out to the downside.

It eventually found support at 1.1300 and came back into the previous trading range, before heading higher to touch the 200-day exponential moving average, which would have been an obvious exit point for many traders who had opened long positions prior to this.

This key moving average then acted as resistance and the price broke below the trendline that indicated the upward trend in August and September, and has continued drifting lower ever since.

EURUSD Price Chart - October 2018

Importance of Pin Bars, Inside Bars, Trendlines and EMA (200)

The real point that I wanted to get across in this article is that if you combine some of the most trusted candlestick patterns with trendlines and key areas of support and resistance, you can get some very powerful trading signals.

That’s exactly what we had with this pair because if you look at the daily price chart of the EUR/USD pair above, you can see all of these things combined to form a powerful reversal signal, and a clear signal to go short.

First of all, the price hit the EMA (200), and if you look at the subsequent price action, you can see that the price struggled to close above this key level.

Secondly, you can see that there was a clear pin bar where the price opened below the EMA (200) and surged higher above 1.1800 during the day’s session, but lacked momentum and dropped back to around its opening price, which was another key signal.

Thirdly, in the few days after this pin bar had formed, the two daily candles traded within the range of the pin bar and both had small bodies, which again indicated a reluctance to take the price higher.

Finally, the price broke below the range of the pin bar (which would have been the perfect time to open a short position), and if you were late to the party, you would have seen that this pair closed below the trendline, which would have given you another good opportunity to open a short position.

The price is now back at around the 1.1500 level. So even if you had entered late, you could have banked up to 170 points so far, which is obviously an excellent return.

Closing Comments

The point is that pin bars, inside bars, key resistance levels and breaks of trendlines are all powerful reversal signals all by themselves, but when they all combine to give the same signal, you end up with a really high probability set-up that is much more likely to be successful.

So it is always worth scanning through the various forex pairs to look for these ultra-strong signals because although they don’t necessarily occur that often, they can be very profitable when they do.

Filed Under: Analysis Tagged With: eurusd, inside bar, pin bar, trendline

  • « Previous Page
  • 1
  • 2
  • 3
  • Next Page »

Forex Rebates:

Choose from 40+ different forex brokers and crypto exchanges, and get cashback every time you trade:


Copy Profitable Traders:

If you join ZuluTrade, you can follow and subscribe to profitable traders and all of their trades will be automatically copied in your own trading account.

You can also earn money as a signal provider if you are already a profitable trader.

Click here to find out more

Recommended Broker:

Recent Blog Posts:

  • High Probability Trade on S&P 500 – 26 January 2024
  • Oanda Moves Into Prop Trading With Labs Trader Program
  • My eToro Performance in 2023 – Up 33.24%
  • The5ers Offering $20K Bootcamp Challenge For Just $1
  • Example of VWAP Bounce Trade on S&P 500 – 18 December 2023

Recent Articles:

VWAP Indicator
  • MA Sabres (LuxAlgo) Indicator
  • 10 Harsh Truths About Forex Trading
  • Best Websites for Monitoring Currency Strengths
  • Xmaster Formula Indicator for MT4 and MT5
  • Tools:

    Currency Heat Map

    Categories

    • Analysis
    • News

    Archives

    • January 2024
    • December 2023
    • November 2023
    • October 2023
    • September 2023
    • August 2023
    • July 2023
    • June 2023
    • May 2023
    • August 2020
    • June 2020
    • May 2020
    • April 2020
    • January 2020
    • December 2019
    • November 2019
    • October 2019
    • September 2019
    • August 2019
    • July 2019
    • June 2019
    • May 2019
    • April 2019
    • March 2019
    • February 2019
    • January 2019
    • December 2018
    • November 2018
    • October 2018
    • September 2018
    • August 2018
    • July 2018
    • June 2018
    • May 2018
    • March 2016
    • December 2015
    • November 2015
    • October 2015
    • August 2015
    • July 2015

    Disclaimer

    This website should be used for general information purposes only and in no way represents professional financial advice.

    Forex and CFD trading carries a high level of risk and it is possible to lose more than your initial deposit if using leveraged products.

    Copyright © 2025 · eleven40 Pro Theme on Genesis Framework · WordPress · Log in

    • About
    • Contact
    • Disclosure
    • Privacy Policy
    • Terms Of Service