The Forex Chronicles

  • Rebates
  • Brokers
  • News
  • Analysis
  • Signals
    • Best Copy / Social Trading Platforms
    • eToro Review
    • FXTM Invest Review
    • Marketclub Review
    • ZuluTrade Review
  • Indicators
  • Strategies
  • Articles

Archives for October 2018

USD/JPY Soars To 114 After Breakout

October 1, 2018 by James Woolley Leave a Comment

Trading Price Breakouts

If you are new to forex trading, one of the easiest ways to get started is to simply concentrate on trading price breakouts.

The key here is to find currency pairs that are trading sideways in a narrow trading range on the daily chart, draw trendlines connecting the highs and the lows, and wait for the price to close outside of this range with strong momentum.

In an ideal scenario, you also want to see a series of short, mid and long-term exponential moving averages (I use the 20, 50, 100 and 200-period EMAs) all trading close together because this indicates a period of consolidation and indecisiveness, and is a common pattern that you will often see before a strong breakout.

USD/JPY Breakout

If you visit this site regularly, you will know that I will often highlight some of the most promising set-ups, and a few weeks ago I highlighted the potential for the USD/JPY to break out of its current trading range.

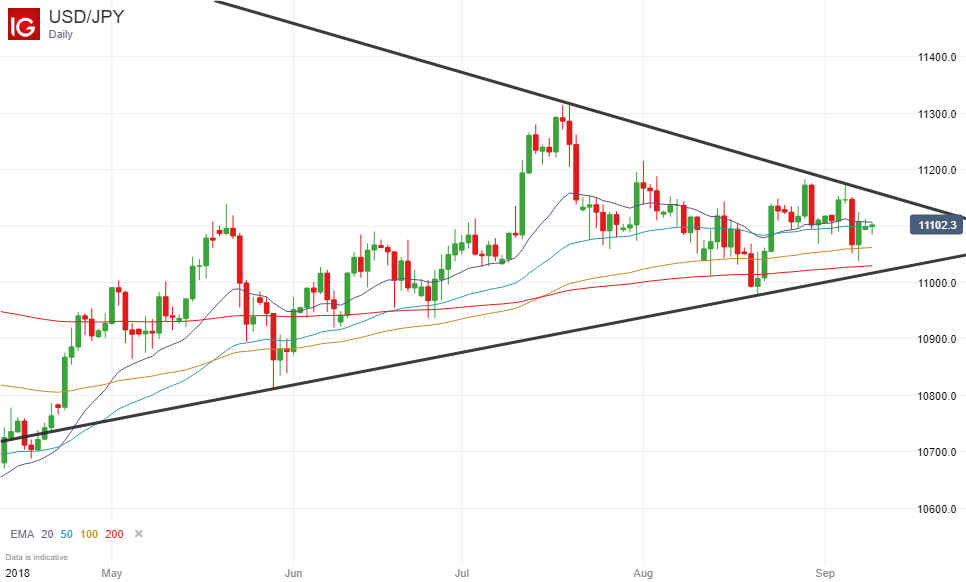
This was because it continued to trade within an ever decreasing sideways trading range with little volatility or momentum, and all the EMAs were tightly squeezed together in readiness for a potential breakout.

So as a result of these favorable trading criteria, I said that there was a real chance that we would see a decent breakout if the price breaks through the upper or lower trendline (at around 112 or 110 respectively), and as it turned out, it was the upper trendline that was breached.

USD/JPY Breakout Before and After Results

Here is the pre-breakout chart of the USD/JPY pair….

USDJPY Price Chart - 10 September 2018

….and this is what subsequently happened….

USDJPY Breakout - September 2018

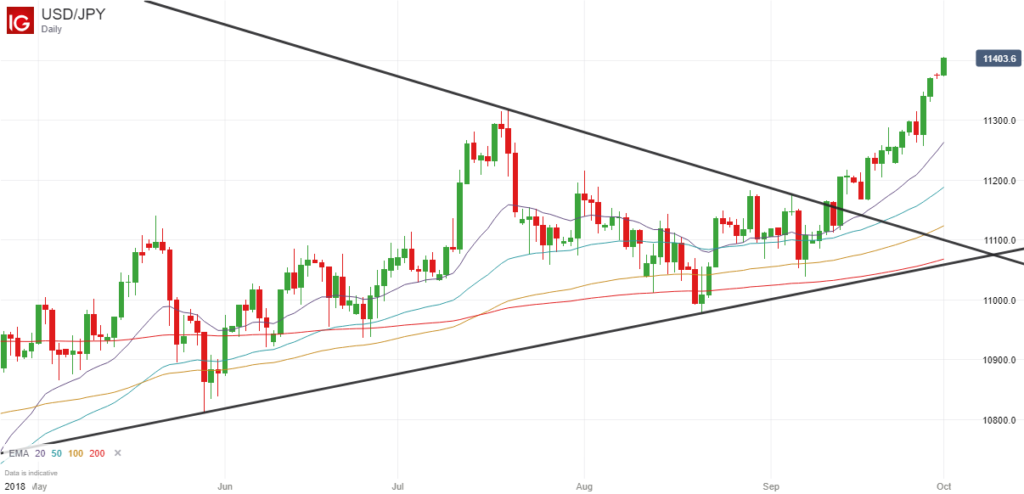
As you can see, the price of the USD/JPY has hit 114 after breaking out of its previous sideways trading range, giving a total profit of around 200 points so far.

Final Thoughts

Of course everyone will trade these breakouts differently. Some traders may look for even more profits, possibly equivalent to two or three times the width of the trading range, for example, while others will scale out of their positions in two stages or will have much smaller profit targets than 200 points.

The point I want to get across is that these price breakouts can be very profitable, and although you do occasionally get a few false breakouts (including a few that I have highlighted in previous articles), the profitable ones will often compensate for the losing ones in the long run if you use strict stop losses and maximize your earning potential with realistic profit targets.

If you want to see a live example of a price breakout, you might want to check out the daily gold chart because this is threatening to break lower and breach its support level, as first pointed out here.

Filed Under: News Tagged With: breakout, usdjpy

  • « Previous Page
  • 1
  • 2
  • 3

Forex Rebates:

Choose from 40+ different forex brokers and crypto exchanges, and get cashback every time you trade:


Copy Profitable Traders:

If you join ZuluTrade, you can follow and subscribe to profitable traders and all of their trades will be automatically copied in your own trading account.

You can also earn money as a signal provider if you are already a profitable trader.

Click here to find out more

Recommended Broker:

Recent Blog Posts:

  • High Probability Trade on S&P 500 – 26 January 2024
  • Oanda Moves Into Prop Trading With Labs Trader Program
  • My eToro Performance in 2023 – Up 33.24%
  • The5ers Offering $20K Bootcamp Challenge For Just $1
  • Example of VWAP Bounce Trade on S&P 500 – 18 December 2023

Recent Articles:

VWAP Indicator
  • MA Sabres (LuxAlgo) Indicator
  • 10 Harsh Truths About Forex Trading
  • Best Websites for Monitoring Currency Strengths
  • Xmaster Formula Indicator for MT4 and MT5
  • Tools:

    Currency Heat Map

    Categories

    • Analysis
    • News

    Archives

    • January 2024
    • December 2023
    • November 2023
    • October 2023
    • September 2023
    • August 2023
    • July 2023
    • June 2023
    • May 2023
    • August 2020
    • June 2020
    • May 2020
    • April 2020
    • January 2020
    • December 2019
    • November 2019
    • October 2019
    • September 2019
    • August 2019
    • July 2019
    • June 2019
    • May 2019
    • April 2019
    • March 2019
    • February 2019
    • January 2019
    • December 2018
    • November 2018
    • October 2018
    • September 2018
    • August 2018
    • July 2018
    • June 2018
    • May 2018
    • March 2016
    • December 2015
    • November 2015
    • October 2015
    • August 2015
    • July 2015

    Disclaimer

    This website should be used for general information purposes only and in no way represents professional financial advice.

    Forex and CFD trading carries a high level of risk and it is possible to lose more than your initial deposit if using leveraged products.

    Copyright © 2025 · eleven40 Pro Theme on Genesis Framework · WordPress · Log in

    • About
    • Contact
    • Disclosure
    • Privacy Policy
    • Terms Of Service