The Forex Chronicles

  • Rebates
  • Brokers
  • News
  • Analysis
  • Signals
    • Best Copy / Social Trading Platforms
    • eToro Review
    • FXTM Invest Review
    • Marketclub Review
    • ZuluTrade Review
  • Indicators
  • Strategies
  • Articles

Archives for November 2018

Possible Inside Bar Breakout On GBP/JPY Pair – 29 November 2018

November 29, 2018 by James Woolley Leave a Comment

Introduction

The GBP pairs have been almost impossible to trade just recently because of the ongoing uncertainties surrounding Brexit, which is why it is sometimes a good idea to just wait for a breakout from an established trading range.

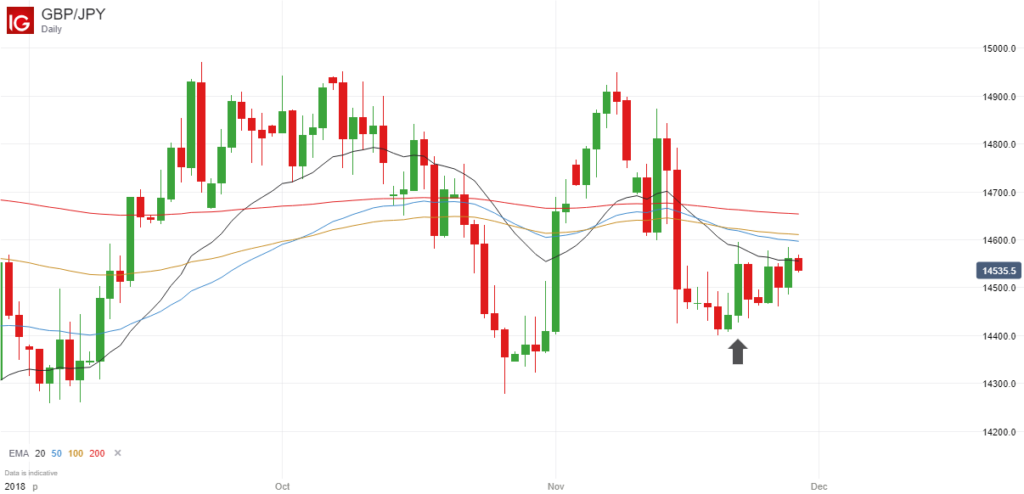
Therefore with that in mind, it may be worth taking a look at the GBP/JPY pair right now because there has recently been a series of four consecutive inside bars (five if you include Sunday’s trading session).

So in other words, after the large candlestick from last Thursday, the price has traded within the range of this candle every day since then, as you can see in the chart below:

GBPJPY Inside Bars - 29 November 2018

Why is This Significant?

These inside bars highlight a period of uncertainty because the price has failed to break above or below the respective high and low of this candle since then.

In addition, you will also notice that the EMAs that I like to use (20, 50, 100 and 200) are all closely bunched together, which often occurs before a breakout.

Therefore when the price does eventually break above or below this initial candle from last Thursday, there may well be a decent breakout.

Trading Opportunity

With four consecutive inside bars, the likelihood of a major breakout continues to grow, so it might be a good strategy to enter a long order a few pips above the high of the initial candle (14595.9), and enter a short order a few pips below the low of this candle (14426.5) in case there is a downward breakout.

There is the potential for the price to break through the EMA (200) if there is an upwards breakout, and this may be a good place to close half the position, while the price could test the recent lows at around 142.50 if there is a downward breakout.

However, as always, I am not offering any trading advice and am not recommending any trades. These are just my own personal views and observations.

Filed Under: Analysis Tagged With: breakout, gbpjpy, inside bar

A Perfect Early Morning Breakout Trade – 27 November 2018

November 27, 2018 by James Woolley Leave a Comment

Introduction

I used to trade early morning breakouts quite a lot in the past, and to be honest, I have forgot just how profitable they can be.

The downside is that you need to be at your computer early in the morning between about 6 AM and 8AM (UK time), which is why I haven’t really had the opportunity to trade these breakouts recently, but if you are available at this time, you can get some strong and predictable price moves.

As you may have discovered yourself, the GBP/USD is a very difficult pair to trade right now because it is so sensitive to any Brexit announcements, and seems to be waiting for any many major developments before moving strongly in either direction.

That’s why short-term day trading may be the best way to trade this pair right now, and early morning breakouts are ideal because an average trade may only last about an hour or two at the most, and they obviously occur early in the day when there is unlikely to be any market-moving news other than the occasional economic data release.

How To Trade These Breakouts

The key to success with this type of strategy is to wait until you have a very small overnight trading range between 12 AM and 6AM on one or more of the major forex pairs, and then trade the subsequent breakout on a short-term chart (I like to use the 5-minute chart).

It is imperative that you have a tight overnight trading range in comparison to the average trading range because then there is the potential for the price to move a lot more when it does break out of this range. Therefore you may not necessarily get a decent set-up every day.

Once the price breaks out, which could be before or after the London market opens, you can enter a long or a short position when the 5-minute candle closes, and either scale out of the trade in stages, moving your stop loss to break-even as soon as possible to effectively ensure a free trade, or set yourself a price target based on the chart.

I have found that pivot points act as excellent price targets because the price will often be driven upwards or downwards to hit these key points on the charts.

GBP/USD Breakout From Earlier Today

To show you how effective this breakout strategy can be, you only need to look at how the GBP/USD traded earlier today.

GBPUSD Early Morning Breakout - 27 November 2018

In this instance the price traded within a really tight trading range of just 15.8 points between 12 AM and 6 AM, compared to the average daily trading range of 101.8 points, and so when the price broke strongly downwards out of this range and closed at around 1.2800 on the 5-minute breakout candle, this would have been a good place to enter a short position.

As you can see, the price went straight down to the S1 pivot point level, which would have been a good place to exit your position or close half and move your stop to break-even, and the price actually continued to fall, falling just short of the S2 level.

All this happened before the London market opened, so the point is that you can find some profitable early morning breakout trades if you are available to trade at this time.

Of course not all of these breakouts will be profitable, but if you wait for the very best set-ups with very narrow overnight trading ranges, you should hopefully have more winning trades than losing ones.

Filed Under: News Tagged With: breakout, early morning breakout, gbpusd

I Have Joined eToro As A Trader / Investor

November 26, 2018 by James Woolley Leave a Comment

Introduction To eToro

I have known about eToro for a long time because they have always been one of the most popular social and copy trading platforms.

Indeed as a seasoned trader myself, I have always been attracted by the idea of other people copying my trades, but have never really been tempted to join eToro because the spreads are quite large for many of the major forex pairs, and they didn’t really have many other markets that you could trade.

However after discovering that they now quote prices for FTSE 100 and FTSE 250 stocks and enable you to actually own stocks and receive dividends, in addition to being able to go long or short via CFDs, I have now decided to open an account and start trading.

SteadyProfits Profile Page on eToro

Trading Capital

After going through the verification process, I have already made my first deposit and started placing a few trades.

My initial deposit was actually quite small because I wanted to test out the trading platform first of all before I start trading with serious money, but I soon learned that this wasn’t really enough because the minimum trading size for stocks is $500 for new traders who have joined after 2017.

So I will be adding some more funds soon because I don’t really want to be trading stocks with leveraged CFDs because of the overnight fees that you have to pay every day.

eToro Goals and Ambitions

As I mention in my trader profile (SteadyProfits), I have been trading stocks for around 20 years now, and therefore have a lot of experience.

I have already built up a decent sum of money in my ISA over the years, but I hope to achieve the same results with eToro so that I can ultimately become a Popular Investor, build up a large following and help other people make some money.

To be honest, I also view this as an exciting challenge and a chance to really test myself, which is why I have set my sights high. My goal is simple – to become one of the top traders on eToro.

Trading Style

Although I have traded forex for many years as well, hence why I originally set up this website, I don’t currently intend to trade currencies with this account because I actually enjoy trading stocks a lot more, and don’t necessarily want to be sat in front of a computer screen all day.

I have no intention of trading cryptocurrencies either because this is far too risky for me, and in some respects is little more than gambling, even if you are using technical analysis.

So I will primarily be trading UK stocks and ETFs, and although I may make use of CFDs to open some short or medium-term trades, I will generally be buying stocks outright once I have a fully funded account to avoid paying overnight financing fees.

I always look for oversold / undervalued stocks and tend to focus on large-cap dividend stocks because this reduces my risk and gives me a steady flow of income, and by reinvesting these dividends into other high dividend stocks, I have found that you can really benefit from the effects of compounding over time.

I am prepared to hold on to stocks for days, weeks, months or years, and if a company is consistently growing both their earnings and their dividends year on year, I am prepared to hold on to a stock forever.

I don’t really set myself any profit targets. My goal is simply to build my capital over time through trading and investing in high dividend stocks, and consistently reinvesting the dividends and profits.

Early Trading Results

I have only been trading for one week so far, but have already placed three trades in that time.

As mentioned above, I am still using a small amount of capital and haven’t fully funded my account yet, so I have been confined to using CFDs with 5x leverage, which is far more risk that I would ordinarily like to take on.

Nevertheless, the early results have been OK. I bought LLOY at 54.74 and sold the same day at 55.35, and also bought one of my favourite stocks, GVC, at 760.18 and sold at 800.78 three days later.

I also bought IMB (IMT.L on eToro) and collected the dividend on ex-dividend day, but this position is still in the red at the time of writing. However it is looking massively oversold and should hopefully move higher soon.

Follow Me on eToro

If you would like to follow my journey on eToro, simply go to the eToro website and search for SteadyProfits to view my live trading results.

I will be posting regular updates on my eToro feed, but will also be posting regular updates on this blog as well.

Whatever happens, I’m really excited to be a member of eToro because it has given me a whole new challenge, and once I have added some more funds, I will really be taking this seriously.

Past performance is not an indication of future results. This content is for information and educational purposes only and should not be considered investment advice nor portfolio management. 81% of retail investor accounts lose money when trading CFDs with this provider.

Filed Under: News Tagged With: etoro, steadyprofits

Dow Jones Trading in Symmetrical Triangle Heading into Thanksgiving

November 20, 2018 by James Woolley Leave a Comment

Price Action

The markets have been fairly turbulent in recent weeks. After a big sell-off that took the Dow Jones all the way down to 24,120, the markets bounced back and the Dow went on to hit a high of 26,278.

However despite this temporary strength, I think many traders and investors were wary that this may be a dead cat bounce and further weakness may be just around the corner, and this has proven to be the case so far because the Dow has since fallen back to 24,902 at the time of writing (based on the future price pre-opening).

Dow Jones Symmetrical Triangle - November 2018

Symmetrical Triangle and EMA Convergence

If you take a look at the daily price chart of the Dow Jones above, you can see that the price has been trading in a symmetrical triangle if you draw some trendlines connecting the highs and the lows of the recent price action.

Furthermore, you can also see that the EMAs that I like to use, ie the 20, 50, 100 and 200-period EMAs, have all converged and are tightly packed together.

Both of these chart patterns generally point to a possible breakout when they occur together, and with the symmetrical triangle getting smaller and smaller every day, a breakout is looking highly likely right now.

Trading Opportunity

At the moment the price is trading very close to the bottom of the triangle, and is therefore very close to breaking below the lower trendline and breaking out to the downside.

However it is still unclear whether the price is actually going to break below this trendline or whether it will find support at this level.

You would normally expect the price to continue falling, but we are now in Thanksgiving week, which is usually a very good week for the major stock markets, with the S&P 500 higher 75% of the time since 1945, for example.

So any downward breakout may be curtailed by a short-term rally during the remainder of Thanksgiving week, and with Christmas just around the corner, there could well be a Santa rally to look forward to in about a month’s time.

Therefore while this would ordinarily be a possible breakout opportunity, you have to be very careful if you are tempted to sell any downward breakout. Indeed I wouldn’t be at all surprised if the upper trendline is breached in the coming weeks.

Filed Under: Analysis Tagged With: breakout, dow jones

EUR/GBP A Sell At 0.8900?

November 19, 2018 by James Woolley Leave a Comment

Brexit Chaos

Some financial experts have recently claimed that the GBP pairs have become untradable just recently as a result of the ongoing chaos surrounding the Brexit negotiations, and it is hard to disagree with this.

That’s because there is so much uncertainty surrounding the Brexit deal, and so many questions still to be answered:

  • will Theresa May survive a plot to oust her from within her own government?
  • if she survives, does she have enough support to get the agreement through?
  • will the Brexit deal be delayed or changed if there is a change in leader?
  • will there be a catastrophic no-deal Brexit?
  • could there even be a second referendum?

It seems that every day that are several stories that only add to the confusion and chaos, and all of these events have a major effect on the GBP pairs.

However at the time of writing, it would appear that Theresa May’s position is looking a little stronger, and there is a greater likelihood that her Brexit deal will go through, although there are no still no guarantees of anything of course.

Time To Sell EUR/GBP?

The Euro rallied hard against the pound last week for obvious reasons, moving from 0.8656 to a high of 0.8908, but it is clear from looking at the price chart that the price has reached the upper trendline that has recently been established:

EURGBP Price Chart - November 2018

Subsequently, this trendline may well act as a strong resistance level in the coming days and weeks, even amidst all of the ongoing chaos surrounding Brexit.

Potential Trading Opportunity

The longer term downward trendline currently sits just above the 0.8900 level, which is interestingly a nice round number. So this is another reason why this pair may be sold off at this key level.

Therefore if you were thinking of trading this EUR/GBP pair, it might be worth looking for a strong reversal signal around this 0.8900 level, such as a pin bar or a divergence pattern on the MACD, RSI and stochastics indicators.

You could also move down to the 4-hour chart and look for the same reversal signals on this lower time frame to get you into a trade earlier.

Anyway these are just my own thoughts and opinions on the future direction of this pair. At this moment in time, I would say that a reversal is looking more likely, particularly with Theresa May’s position strengthening, but please note that I am not offering any trading or financial advice. This would still be a risky trade because this and other GBP pairs are still vulnerable to any major Brexit developments.

Filed Under: Analysis Tagged With: eurgbp

  • 1
  • 2
  • 3
  • Next Page »

Forex Rebates:

Choose from 40+ different forex brokers and crypto exchanges, and get cashback every time you trade:


Copy Profitable Traders:

If you join ZuluTrade, you can follow and subscribe to profitable traders and all of their trades will be automatically copied in your own trading account.

You can also earn money as a signal provider if you are already a profitable trader.

Click here to find out more

Recommended Broker:

Recent Blog Posts:

  • High Probability Trade on S&P 500 – 26 January 2024
  • Oanda Moves Into Prop Trading With Labs Trader Program
  • My eToro Performance in 2023 – Up 33.24%
  • The5ers Offering $20K Bootcamp Challenge For Just $1
  • Example of VWAP Bounce Trade on S&P 500 – 18 December 2023

Recent Articles:

VWAP Indicator
  • MA Sabres (LuxAlgo) Indicator
  • 10 Harsh Truths About Forex Trading
  • Best Websites for Monitoring Currency Strengths
  • Xmaster Formula Indicator for MT4 and MT5
  • Tools:

    Currency Heat Map

    Categories

    • Analysis
    • News

    Archives

    • January 2024
    • December 2023
    • November 2023
    • October 2023
    • September 2023
    • August 2023
    • July 2023
    • June 2023
    • May 2023
    • August 2020
    • June 2020
    • May 2020
    • April 2020
    • January 2020
    • December 2019
    • November 2019
    • October 2019
    • September 2019
    • August 2019
    • July 2019
    • June 2019
    • May 2019
    • April 2019
    • March 2019
    • February 2019
    • January 2019
    • December 2018
    • November 2018
    • October 2018
    • September 2018
    • August 2018
    • July 2018
    • June 2018
    • May 2018
    • March 2016
    • December 2015
    • November 2015
    • October 2015
    • August 2015
    • July 2015

    Disclaimer

    This website should be used for general information purposes only and in no way represents professional financial advice.

    Forex and CFD trading carries a high level of risk and it is possible to lose more than your initial deposit if using leveraged products.

    Copyright © 2025 · eleven40 Pro Theme on Genesis Framework · WordPress · Log in

    • About
    • Contact
    • Disclosure
    • Privacy Policy
    • Terms Of Service