The Forex Chronicles

  • Rebates
  • Brokers
  • News
  • Analysis
  • Signals
    • Best Copy / Social Trading Platforms
    • eToro Review
    • FXTM Invest Review
    • Marketclub Review
    • ZuluTrade Review
  • Indicators
  • Strategies
  • Articles

Archives for January 2019

eToro Trading Update – 31 January 2019

January 31, 2019 by James Woolley Leave a Comment

A Profitable January

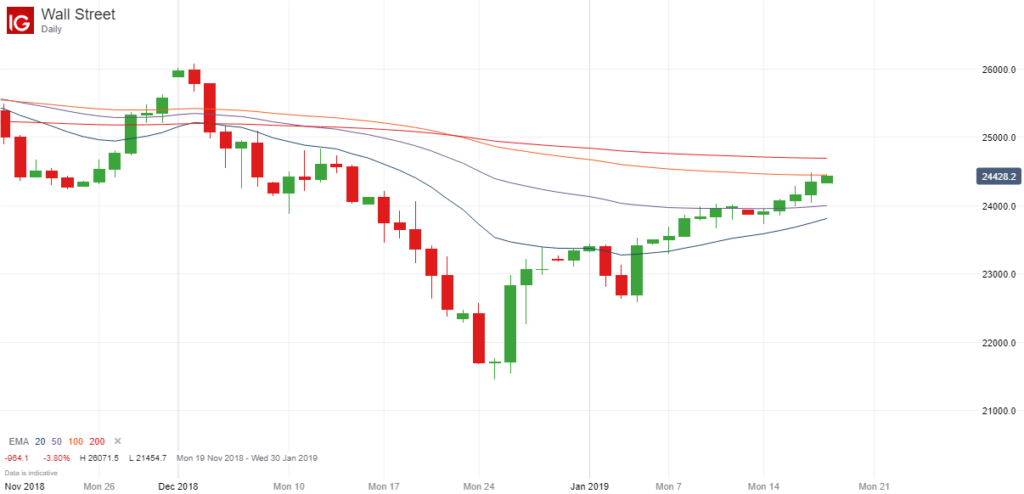
It is fair to say that my account is still suffering from the drubbing it took in November and December, which as I said before, was one of the worst times that I could have opened an account and started trading stocks.

Nevertheless I’m not overly concerned because my eToro account (SteadyProfits) has recovered quite well in January, and I see this as a long-term game rather than a short-term road to riches.

At the time of writing, my account is up 4.23% this month with just one trading day left, but overall it is still down 4.88% since I first started trading in November.

SteadyProfits Trading Performance - January 2019

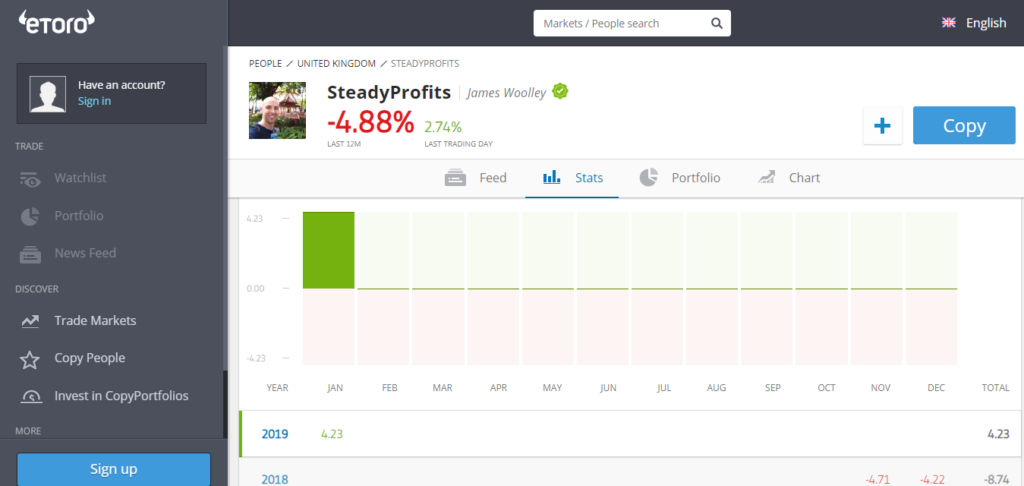
(In reality my account is only down 0.82%, but I made the mistake of making a big deposit when I was in profit for the month, which has negatively distorted my performance results for the year).

Portfolio Analysis

After Apple (AAPL) and British American Tobacco (BATS.L) both surged higher this week, my overall portfolio is now looking a lot healthier.

Both of these stocks are now just below my entry price, but there is still a lot of upside potential in both instances because they are still massively undervalued based on their low P/E ratios.

I have a minimum long-term target price of $200 for Apple based on forward earnings estimates and I am still confident that BATS will hit 3000p at some point this year, which is about 15% higher than it is today.

I have one other tobacco holding – Philip Morris (PM) – and this too has recovered strongly, but I will probably look to get out at break-even in this case because my entry price was far too high in hindsight.

The good thing about PM is that it pays a decent dividend every 3 months, just like BATS, so I have no problem waiting for the price to recover, and I may just decide to hold on to it for a few years even if it gets back to $80.

My biggest holding is GVC, which is establishing itself as one of the biggest gaming companies in the world, but this has performed poorly this month.

Nevertheless this is very much a long-term holding and I am still holding out for a minimum price target of 800p, which should hopefully be taken out some time this year because it is still trading on a low P/E ratio and has a high dividend yield at its current price of 662p.

My only other holding is my FTSE 100 tracker (ISF.L), which is now up 1.52% overall, but I don’t really pay too much attention to the price of this ETF because this is a long-term holding that I intend to keep for many years because of its lucrative quarterly dividends and its long-term growth potential.

Short-Term Trades

As well as holding stocks for medium and long-term gains, plus of course the dividends, I also like to trade stocks on a short-term basis whenever I see some good opportunities, and in that respect, January has been a very profitable month.

I opened long positions on Aviva (AV.L), GVC (GVC.L) and IG Group (IGG.L), and managed to bank some decent profits from each of these stocks.

Outlook – Dividends Coming Soon

Although I am waiting for the markets to have some kind of pull-back in the coming weeks, I am very confident about the coming months because the ex-dividend date is rapidly approaching for all of the stocks and ETFs in my portfolio, and because eToro pays dividends on this ex-dividend date, these funds will soon be added to my account ready to be reinvested.

I also have a decent amount of cash sitting on the sidelines ready to be reinvested should the markets fall in the meantime, so I feel that I am in quite a strong position.

Follow Me on eToro

If you would like to follow my journey on eToro, simply go to the eToro website and search for SteadyProfits to view my live trading results and to see my latest trades.

You might also like to read my review of eToro to learn more about how this social trading platform works, if you haven’t already done so.

Past performance is not an indication of future results. This content is for information and educational purposes only and should not be considered investment advice nor portfolio management. 81% of retail investor accounts lose money when trading CFDs with this provider.

Filed Under: News Tagged With: etoro, steadyprofits

Average Daily Trading Range of the Major Forex Pairs in 2019

January 30, 2019 by James Woolley 2 Comments

If you are day trading the forex markets, it is important that you trade those currency pairs that have tight spreads first of all, but it is also a good idea to trade the more volatile pairs that have large average trading ranges every day because this will make it a lot easier to generate consistent profits.

Similarly, if you are considering trading other markets on a short-term basis, you also need to look at how many points they tend to move on average per day, in order to weigh up whether or not they are worth trading.

So just as I did last year, I thought it might be useful to once again list the average daily trading range of all the major currency pairs, as well as all of the most popular indices, commodities and cryptocurrencies (as of 30 January 2019):

AUD/NZD – 52
AUD/USD – 53
EUR/CHF – 43
EUR/GBP – 64
EUR/JPY – 77
EUR/USD – 56
GBP/JPY – 131
GBP/USD – 101
USD/CAD – 62
USD/CHF – 46
USD/JPY – 56

FTSE 100 – 82
DOW JONES – 322
S&P 500 – 33
NASDAQ – 107

BRENT CRUDE – 164
US CRUDE – 153
GOLD – 9

BITCOIN – 137
BITCOIN CASH – 10
ETHEREUM – 7
RIPPLE – 2
LITECOIN – 2

(all figures quoted have been rounded up or down to the nearest whole number)

Starting with the main forex pairs, it is clear that the GBP/JPY and GBP/USD pairs both look particularly appealing to short-term traders right now because they both have an average daily trading range of over 100 pips.

However much of this volatility is due to the ongoing uncertainty surrounding Brexit, so day traders need to be wary of any breaking news when trading these or any other GBP pairs.

Apart from these pairs, many of the major currency pairs have an average trading range of around 50-70 pips, which is more than enough to be able to trade, providing that the spreads are around 2-3 pips at the most, but it is worth noting that nearly all of them have seen their average trading range go down a little in recent weeks, including the EUR/USD pair, as you can see in the chart below:

ATR of EURUSD Pair - January 2019

It could be argued that the indices are the main markets that day traders should consider trading right now because these have very large average daily trading ranges at the moment.

The Dow Jones typically moves 322 points per day and the NASDAQ typically moves over 100 points per day, while even the FTSE 100 tends to move 82 points per day, which is a lot higher than it is usually.

With regards to the oil markets, these have always been very popular markets to trade for day traders, and with an average range of over 150 points for both Brent and US Crude, they are still very tradable right now.

Finally, it is worth noting that the major cryptos are still not really suitable for day trading because of the low volatility of these instruments and the large spreads.

Even though Bitcoin has a daily trading range of 137 points, a typical spread of 30-50 makes it almost impossible to make consistent short-term profits, and it is a similar story with many of the other cryptos as well.

Anyway I hope you found this information useful. I will update this page with the latest average trading ranges throughout 2019 to give you an idea of which forex pairs and which markets are the most volatile, and therefore potentially the most profitable to trade at any given time.

If you are interested in day trading yourself, it is important to use a broker that has tight spreads and fast execution, and FXTM satisfies both of these criteria, with spreads starting from 0.1 points on ECN accounts and 0.5 points on Standard accounts.

Latest Trading Ranges in May 2019

It is always interesting to see how the markets have evolved, and which instruments seem to be the most volatile (and therefore potentially the best ones for trading) at any given time.

So with that in mind, here are the latest trading ranges for all of the currency pairs, stock markets, commodities and cryptocurrencies listed above, along with the previous trading ranges from January (shown in brackets):

AUD/NZD – 46 (52)
AUD/USD – 44 (53)
EUR/CHF – 38 (43)
EUR/GBP – 41 (64)
EUR/JPY – 60 (77)
EUR/USD – 45 (56)
GBP/JPY – 88 (131)
GBP/USD – 75 (101)
USD/CAD – 60 (62)
USD/CHF – 38 (46)
USD/JPY – 44 (56)

FTSE 100 – 61 (82)
DOW JONES – 246 (322)
S&P 500 – 26 (33)
NASDAQ – 91 (107)

BRENT CRUDE – 135 (164)
US CRUDE – 131 (153)
GOLD – 9 (9)

BITCOIN – 209 (137)
BITCOIN CASH – 22 (10)
ETHEREUM – 9 (7)
RIPPLE – 1 (2)
LITECOIN – 5 (2)

Starting with the major currencies, it is immediately obvious by comparing the latest average trading ranges with those from January that the forex markets have generally become a lot less volatile.

Every single currency pair is trading within a smaller range on a daily basis, and it is noticeable that the GBP pairs in particular are significantly less volatile than they were before. This is probably due to a stalemate in the whole Brexit affair and a long and lengthy delay that is pretty much guaranteed.

It is not just the forex pairs that have become less volatile. The world’s major stock markets are trading within smaller ranges on a daily basis, as indeed are the oil markets. The only exception is gold, which is still moving around 9 points per day, as it was before.

The most interesting finding from these latest figures is that the major cryptocurrencies appear to have become a lot more volatile than before. However when you consider that many of them have risen sharply in recent months, they are probably about the same in relative terms.

So I wouldn’t necessarily start assuming that cryptos are the top trading instruments for day traders right now. Even though many of the markets are trading in smaller ranges as we approach summer, these will always be some of the best markets to trade because they have much tighter spreads. They are just a little harder to trade at this time of the year.

Update for September 2019

The quiet summer period is now coming to an end, although with the ongoing uncertainty surrounding Brexit, it is fair to say that the major forex pairs, particularly the British pound pairs, haven’t been as quiet and as so-moving as they have been in previous summers.

Before I discuss this any further, let me give you the updated average daily trading ranges for all of the major indices, currency pairs, commodities and cryptocurrencies (previous trading ranges from May are shown in brackets):

AUD/NZD – 49 (46)
AUD/USD – 42 (44)
EUR/CHF – 47 (38)
EUR/GBP – 69 (41)
EUR/JPY – 78 (60)
EUR/USD – 50 (45)
GBP/JPY – 136 (88)
GBP/USD – 99 (75)
USD/CAD – 61 (60)
USD/CHF – 57 (38)
USD/JPY – 67 (44)

FTSE 100 – 93 (61)
DOW JONES – 380 (246)
S&P 500 – 43 (26)
NASDAQ – 137 (91)

BRENT CRUDE – 151 (135)
US CRUDE – 159 (131)
GOLD – 21 (9)

BITCOIN – 503 (209)
BITCOIN CASH – 17 (22)
ETHEREUM – 10 (9)
RIPPLE – 2 (1)
LITECOIN – 5 (5)

Apart from the very volatile Bitcoin, which now trades within a range of over 500 points per day on average, the cryptocurrencies haven’t really increased or decreased in volatility since the last update back in May.

However you can see that many of the other markets have actually become a lot more volatile thanks to a combination of Brexit, Donald Trump, ongoing trade wars and the threat of a possible recession.

Both Brent crude oil and US crude have seen slightly higher average trading ranges towards the end of summer, while gold’s average trading range has more than doubled as a result of people moving some of their capital into this traditional safe haven.

The indices have also become a lot more volatile as a result of some fairly wild swings and a lot of uncertainty in the markets right now.

Finally, as mentioned earlier, many of the major currency pairs have also seen their average daily trading ranges go up in recent weeks and months. This is true of the dollar and euro pairs, but it is the pound pairs that have been experiencing some large daily price moves, and that is only likely to continue as the Brexit deadline draws ever closer.

Update for 2023

If you would like to see how the markets have changed over the years since this post was first published, and whether they have each become more or less volatile, I have published a post that shows the average trading ranges of all of the main markets in 2023.

Filed Under: Analysis Tagged With: atr, average true range, daily trading range

AUD/NZD Still in a Very Strong Downward Trend in January 2019

January 28, 2019 by James Woolley Leave a Comment

Introduction

A lot of traders tend to focus on the British pound, the US dollar and the Japanese yen when trading the currency markets, but there are a few other pairs that have relatively low spreads, and are potentially very profitable to trade.

One such pair that often goes unnoticed by traders is the AUD/NZD pair, but it has been interesting to watch the price action of this particular pair in recent times because the New Zealand dollar continues to strengthen against the Australian dollar over time, and is not really showing any signs of reversing this trend.

Strong Downward Trend

One way of determining the current price trend is to add the 20, 50, 100 and 200-period exponential moving averages to your daily price chart, and see where the price trades in relation to these moving averages.

If the price is above all four of these moving averages, then it is in a strong upward trend, and if it is trading below all four of these moving averages, it is obviously in a strong downward trend.

Furthermore, if the price is also trading above or below these moving averages on multiple time frames, such as the weekly and monthly charts, for example, then you know that it is in an established long-term trend right now.

That’s precisely the case with the AUD/NZD pair because as you can see from the chart below, the price is trading below the 20, 50, 100 and 200-period exponential moving average on the monthly, weekly, daily and 4-hour charts:

AUDNZD Strong Downward Trend - January 2019

Trading Opportunity

The question is; how you can actually capitalize on this long-term trend?

Well with such a strong trend in place, you might think that you can make money just by selling into any strength, and in many cases this may well be profitable.

However I would probably look for opportunities to go short on the daily time frame, and particularly around the 100 and 200-day moving averages because this is where the price is likely to run into some strong resistance.

Therefore any time there is a pin bar around these levels or divergence on one or more indicators, for instance, this would probably be a good time to take a short position.

Filed Under: Analysis Tagged With: audnzd

EUR/GBP May Find Support At 2018 Low

January 25, 2019 by James Woolley Leave a Comment

Recent Price Action

The British pound has rallied strongly in recent weeks as the threat of a no-deal Brexit recedes and the likelihood of a delayed Brexit increases as the days go by.

Subsequently the GBP/USD and the GBP/JPY have both moved strongly higher, and the EUR/GBP has fallen sharply as it has strengthened against the Euro.

It is this particular pair that I want to focus on in this article because this popular, slow-moving forex pair is now trading close to a key support level that may just prevent the price from falling any further.

2018 Low

The support level that I am talking about is simply the low of 2018. As you can see in the weekly chart below, the lowest price from last year was 0.8620, and interestingly enough, the current price at the time of writing is just a fraction above this at 0.8634, although it did actually hit this price yesterday before reversing.

EURGBP Weekly Chart - January 2019

Therefore as we haven’t really seen any strong support in this recent price fall, this may be the point at which traders start to bank their profits and open new long positions if there is the slightest indication of strength or a clear sign of a reversal.

Potential Trading Opportunity

Whenever the price of any instrument approaches a key support or resistance level, it is always interesting to watch the price action and see how it reacts around this level.

So in this case we really need to see clear signs of strength in order to be confident of a reversal, even if it turns out to be a relatively modest one.

The price of any pair that includes the British pound is still heavily influenced by Brexit, which means that this is not really a time to take long-term trades.

This is a time to take quick short-term technical trades and get out as soon as you are showing a decent profit, and so it may be worth opening a long trade on a pin bar, for example, on one of the lower time frames.

Alternatively if the price ambles along around this key support level and doesn’t really show any real signs of strength before eventually breaking below this level, this could be a time to jump on board with a short position.

That’s because the price is now trading close to the 200-week exponential moving average, and there is a lot of downside potential if the price breaks below this level.

Either way, it is worth keeping an eye on this particular pair to see what happens in the coming days.

Filed Under: Analysis Tagged With: brexit, eurgbp

Dow Jones and Gold Trading Close to Major Resistance Levels

January 18, 2019 by James Woolley Leave a Comment

Previous Analysis

I have been looking at the price of both gold and the Dow Jones index in recent weeks because they have both been trading close to major resistance levels, and are therefore potentially worth shorting.

Since I wrote these two blog posts, nothing much as changed, particularly in the case of gold, but the Dow Jones has continued to move higher, and is now very close to the major resistance levels that I highlighted previously.

So I thought it would be a good idea to take another look at these two markets and make a prediction as to where they might be headed.

Please note that these are only my own personal opinions and do not in any way represent financial or trading advice of any kind.

Gold

I mentioned before that $1300 is acting as a major resistance level at the moment, and that still seems to be the case today:

Gold Price Chart - 18 January

At that time it was trading at $1283, but as you can see from the chart above, the price has slowly edged higher towards the $1300 level since then.

Nevertheless, it has once again stalled in the $1290s as the general stock markets have continued to rise, and as you can see from the chart above, the price has been trading in an ever decreasing triangle.

Therefore I personally think that it is only a matter of time before we see a breakout, and the likelihood is that it will be a downward one because of the continual round number resistance at $1300 and the tight price action.

So it wouldn’t be at all surprising if the price were to move back to around $1250-$1260, towards the 100 and 200-day moving averages, but if the price was to go back to $1300, it may also be worth opening a short here because I think this would be a fairly high probability set-up as well.

Dow Jones

As mentioned earlier, the Dow Jones has continued to recover from its December lows, and this isn’t really that surprising.

I said in a previous post that the price could easily continue moving higher and test its long-term moving averages, which at that time stood at 24,507 (EMA (100)) and 24,741 (EMA (200)), and at the time of writing, the price is now trading at 24,406 pre-market opening.

Dow Jones Chart - 18 January

Indeed it has just touched the EMA (100) yesterday and today, having risen sharply from a low of 21,454, so it is now looking seriously overbought and could now be ready to turn lower now that it has reached two major resistance levels (the EMA (200) is just 280 points higher).

As always, the market never gives you a clear signal that a top or a bottom has been reached, but with the price trading close to two key moving averages, I think it could be a good opportunity to open a short position if we get a pin bar on the daily chart or one of the lower time frames, for example, because this would also be a high probability set-up.

Filed Under: Analysis Tagged With: dow jones, gold, resistance

  • 1
  • 2
  • Next Page »

Forex Rebates:

Choose from 40+ different forex brokers and crypto exchanges, and get cashback every time you trade:


Copy Profitable Traders:

If you join ZuluTrade, you can follow and subscribe to profitable traders and all of their trades will be automatically copied in your own trading account.

You can also earn money as a signal provider if you are already a profitable trader.

Click here to find out more

Recommended Broker:

Recent Blog Posts:

  • High Probability Trade on S&P 500 – 26 January 2024
  • Oanda Moves Into Prop Trading With Labs Trader Program
  • My eToro Performance in 2023 – Up 33.24%
  • The5ers Offering $20K Bootcamp Challenge For Just $1
  • Example of VWAP Bounce Trade on S&P 500 – 18 December 2023

Recent Articles:

VWAP Indicator
  • MA Sabres (LuxAlgo) Indicator
  • 10 Harsh Truths About Forex Trading
  • Best Websites for Monitoring Currency Strengths
  • Xmaster Formula Indicator for MT4 and MT5
  • Tools:

    Currency Heat Map

    Categories

    • Analysis
    • News

    Archives

    • January 2024
    • December 2023
    • November 2023
    • October 2023
    • September 2023
    • August 2023
    • July 2023
    • June 2023
    • May 2023
    • August 2020
    • June 2020
    • May 2020
    • April 2020
    • January 2020
    • December 2019
    • November 2019
    • October 2019
    • September 2019
    • August 2019
    • July 2019
    • June 2019
    • May 2019
    • April 2019
    • March 2019
    • February 2019
    • January 2019
    • December 2018
    • November 2018
    • October 2018
    • September 2018
    • August 2018
    • July 2018
    • June 2018
    • May 2018
    • March 2016
    • December 2015
    • November 2015
    • October 2015
    • August 2015
    • July 2015

    Disclaimer

    This website should be used for general information purposes only and in no way represents professional financial advice.

    Forex and CFD trading carries a high level of risk and it is possible to lose more than your initial deposit if using leveraged products.

    Copyright © 2025 · eleven40 Pro Theme on Genesis Framework · WordPress · Log in

    • About
    • Contact
    • Disclosure
    • Privacy Policy
    • Terms Of Service