The Forex Chronicles

  • Rebates
  • Brokers
  • News
  • Analysis
  • Signals
    • Best Copy / Social Trading Platforms
    • eToro Review
    • FXTM Invest Review
    • Marketclub Review
    • ZuluTrade Review
  • Indicators
  • Strategies
  • Articles

Archives for January 2019

Crude Oil’s Price Move Highlights Profitability of Inside Bar Breakouts

January 10, 2019 by James Woolley 1 Comment

Inside Bar Breakouts

I have long argued that inside bar breakouts are some of the easiest and most predictable breakouts that you can trade.

All you need to do is wait for quite a large candle on the daily chart (or higher), and wait for a series of consecutive inside bars that all trade within the range of this initial candle.

Then once the price eventually closes above or below the initial candle, you can then enter a trade in the same direction, and profit from the momentum of the breakout.

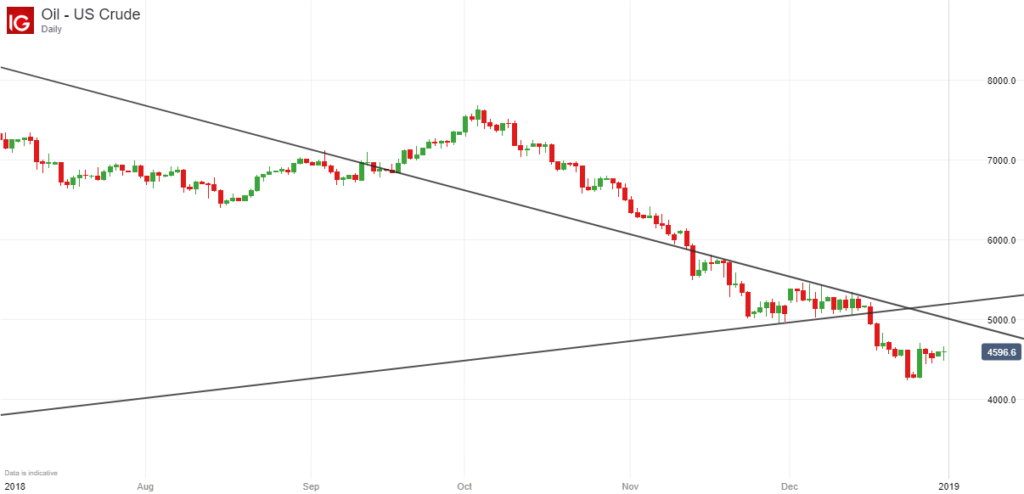
Real Life Example – US Crude Oil

To demonstrate the effectiveness of this simple trading strategy, here is the daily chart of US crude oil that I posted on this website at the start of the month:

US Crude Oil Inside Bars - 1 January 2019

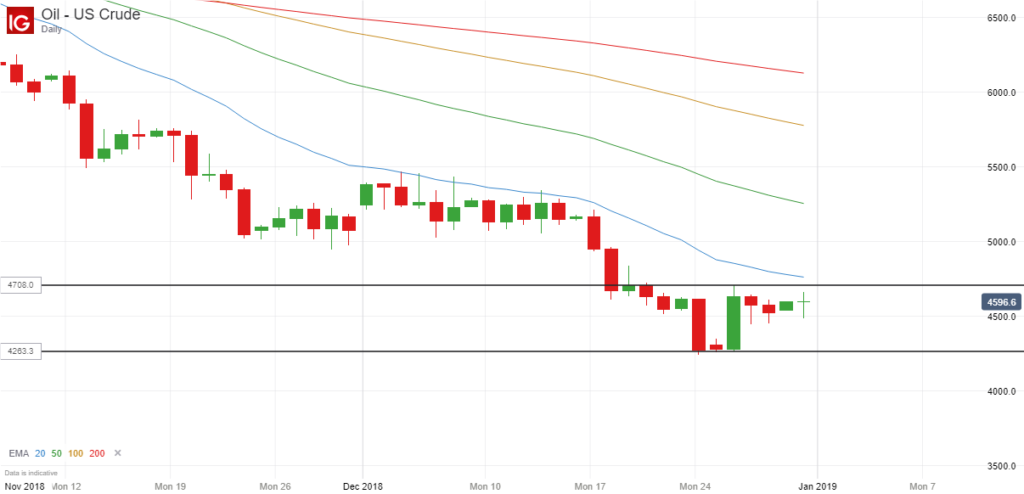
….. and this is what happened when the price finally closed outside of the range of the initial set-up candle:

US Crude Oil Breakout - January 2019

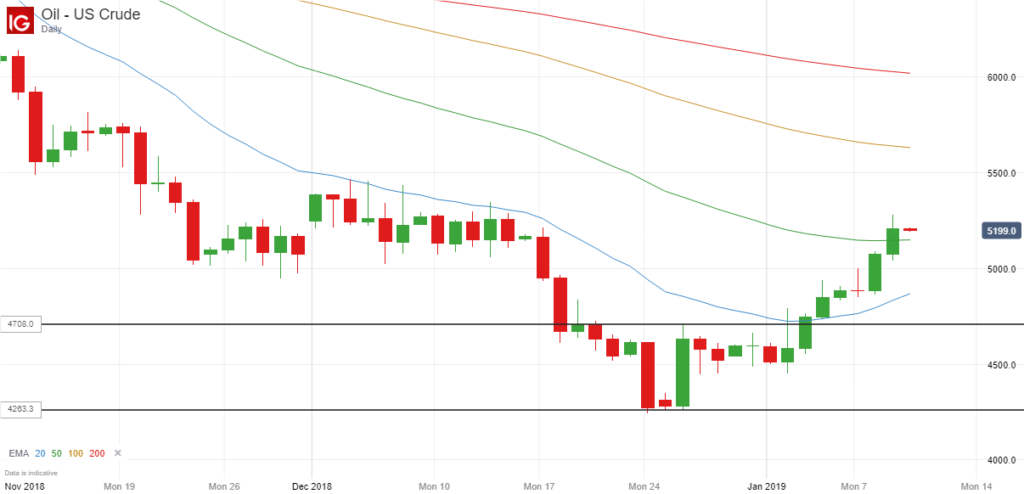
As you can see, there was initially a false breakout where the price moved above but failed to close above the initial candle, followed by a secondary breakout where the price did indeed close above this candle, and this would have been the time to enter a long position.

Once this happened, the price moved strongly higher and went straight to $50, which would have been a natural exit price, but it actually had the momentum to keep on moving higher, and currently stands at around $52.

It could potentially go higher as well because it is still quite a long way below both the 100 and the 200-day moving averages, as shown on the chart above.

Final Thoughts

So hopefully you can see that you don’t necessarily need to use lots of fancy indicators to come up with a winning strategy.

The simplest strategies are often the most profitable, and I always found that inside bar breakouts in particular are generally some of the most predictable and profitable breakouts that you can trade.

The only real drawback is that they don’t occur all that often. So you may have to wait patiently for a really good set-up to occur across all of the major forex pairs and commodities. Alternatively you can apply this strategy to some of the other markets that you like to trade, such as cryptocurrencies or ETFs, for example.

Filed Under: Analysis Tagged With: breakout, inside bar, oil, us crude

Dow Jones Analysis For January 2018 – How High Can It Go?

January 9, 2019 by James Woolley Leave a Comment

December Price Crash

Unless you have been living under a rock for the last few months, you will know that the Dow Jones (and all of the other major indices) completely collapsed last month, continuing on from the initial negativity in November.

The much anticipated Santa rally never really materialised in these panic-driven conditions, and many people will have spent Christmas looking at their depleted portfolios and seeing how much money they have lost on paper.

Despite all this, the markets have staged a recovery after we saw trade war tensions ease and received some positive assurances from the Fed, and they are now significantly higher than their previous lows.

I can certainly vouch for this because my new trading account on eToro (which you can follow or copy by searching for SteadyProfits on eToro) that I was unfortunate enough to open just before the crash, has recovered much of its losses in recent weeks.

The question that many people will be asking now is; how much higher can the Dow Jones go?

Future Price Move

I am not foolish enough to believe that all of the bad news is behind us. There is still a lot of uncertainty surrounding Brexit, there is a possible recession looming in Germany, and tech giants such as Samsung and Apple have warned that profits will be lower than forecast this quarter.

Therefore there could still be another downward wave of selling just around the corner. However as I discussed in yesterday’s post regarding the future gold price, there is still the potential for the markets to continue going a little higher in the near future.

Dow Jones Chart - 9 January 2018

Price Targets / Trading Opportunity

If it does continue to move higher, then the 100 and 200-day exponential moving averages are obvious targets because these are not much higher than today’s price, and are now within range.

The price has already breached the 200-period EMA on the 4-hour chart, but on the daily price chart shown above, it hasn’t even hit the 50-period EMA yet. So there is the potential for the price to move higher and test these key levels, which currently stand at:

  • EMA (100) = 24,507
  • EMA (200) = 24,741

With the price currently standing at 23,820, this represents a potential gain of at least 687 points, or 2.88%.

If it does hit the 100 or 200-day exponential moving average, the markets are likely to see this as a strong resistance level, and I wouldn’t be surprised if this was the start of a new downward price move.

Therefore in terms of a trading opportunity, I would probably be looking for a key reversal signal, such as a pin bar, for example, or divergence on a few key indicators before opening a short position around these key resistance levels.

However these are just my own thoughts and opinions, and it doesn’t represent professional financial or trading advice in any way.

Filed Under: Analysis Tagged With: dow jones

Gold Looking Overbought Around $1300

January 8, 2019 by James Woolley Leave a Comment

Previous Price Action

It is a long time since I talked about gold, but in my last post back in October, I highlighted the upwards price breakout that had just occurred on this particular commodity, and this proved to be a decisive breakout.

I remember saying at the time that I wasn’t really convinced about this specific breakout, but I turned out to be wrong because the price did indeed continue to creep higher in the following months.

This is primarily because people turn to safe havens in times of crisis, and November and December saw some of the biggest stock market falls on record.

As a result, the price of gold currently stands at $1283 at the time of writing, having previously traded close to $1200 for long periods of time.

Future Price Move

The stock markets have actually bounced back in recent weeks, and as a result of this, people have been selling gold to buy stocks, pushing the price down slightly.

After trading close to the $1300 level, which is an important round number, and therefore a key resistance level that needs to be broken, it has since fallen back to $1283, as mentioned above.

However I still think there is a possible trading opportunity here.

Gold Price Chart - 8 January 2019

Trading Opportunity

It is still too early to predict where the stock markets are headed because a continuation of the downward trend could be just around the corner, but I still believe that the price of gold will struggle to break through the significant $1300 level.

Therefore it might be worth looking for a clear reversal signal on the daily chart of this particular market for additional confirmation.

If you look at the price chart above, you can see that we have just had a downward MACD crossover, which is often seen as quite a strong reversal signalby itself, but I personally would be looking to enter a short closer to $1300 if possible.

Ideally I would like to see a pin bar on the daily chart because if the price pushed up towards $1300 once again, but ran out of momentum a second time before breaking lower, this would be the perfect time to go short.

So at the moment we just have to wait and see if this particular scenario plays out, but as always, I want to point out that these are just my own thoughts and opinions. This doesn’t represent professional financial or trading advice in any way.

Filed Under: Analysis Tagged With: gold, gold price

US Crude Oil Update – 1 January 2019

January 1, 2019 by James Woolley Leave a Comment

Previous Breakout

A few weeks ago I highlighted a possible breakout that was shaping up on the daily chart of US crude oil, and as it turned out, this would have been a very profitable trade:

US Crude Oil Breakout - December 2018

After breaking out of the previous trading range and closing below the lower trendline, the price went from around $49.50 to as low as $42.44 in a relatively short period of time.

Inside Bars

Since then, the price has recovered somewhat and is now trading around the $45 – $46 level, having moved relatively little during this quiet Christmas and New Year period.

However it is interesting to note that an inside bar formation has formed on this same daily chart, which suggests that there may be a possible breakout in the next few days.

US Crude Oil Inside Bars - 1 January 2019

What I am basically saying is that after the large bullish candle on 26 December 2018, there have been 3 consecutive inside bars / candles (4 if you include the Sunday session) that have all traded within the range of this particular candle.

Trading Opportunity

This is often a very good set-up if you are looking to trade breakouts because traders will often spot the same breakout themselves and pile into a position once the price closes above or below the initial set-up candle, helping it to become a self-fulfilling breakout for everyone.

In this case, an upward breakout is looking more likely simply because it is trading closer to the high of the initial candle, and we are long overdue a bounce as the price of oil dropped so much last year.

Therefore if the price closes above $47.08 in the coming days without closing too far above this level, this could be a good opportunity to open a long position.

$50 would be an obvious resistance level, so it might be a good idea to target an exit price just below $50, but if it could break through this level, then the price could potentially surge towards the 100 and 200-day EMAs, which are currently at $57.76 and $61.26 respectively.

I personally think the first outcome is more likely because I think it will struggle to break through the $50 at the current time.

If the price doesn’t close above the high of the initial candle and instead breaks below the low of this candle, and indeed the low of the previous candle a few days earlier, then this will really open up the downside.

This would see the price drop to around $42, and if it closed around this level, you could then expect the price to fall below $40 fairly easily.

However at the moment we just have to wait and see what happens. What I will say is that the longer the price trades within the range of the initial set-up candle, the stronger the breakout is likely to be.

As always, please note that these are just my own thoughts and opinions. This doesn’t represent professional trading or financial advice in any way.

Filed Under: Analysis Tagged With: breakout, oil, us crude

  • « Previous Page
  • 1
  • 2

Forex Rebates:

Choose from 40+ different forex brokers and crypto exchanges, and get cashback every time you trade:


Copy Profitable Traders:

If you join ZuluTrade, you can follow and subscribe to profitable traders and all of their trades will be automatically copied in your own trading account.

You can also earn money as a signal provider if you are already a profitable trader.

Click here to find out more

Recommended Broker:

Recent Blog Posts:

  • High Probability Trade on S&P 500 – 26 January 2024
  • Oanda Moves Into Prop Trading With Labs Trader Program
  • My eToro Performance in 2023 – Up 33.24%
  • The5ers Offering $20K Bootcamp Challenge For Just $1
  • Example of VWAP Bounce Trade on S&P 500 – 18 December 2023

Recent Articles:

VWAP Indicator
  • MA Sabres (LuxAlgo) Indicator
  • 10 Harsh Truths About Forex Trading
  • Best Websites for Monitoring Currency Strengths
  • Xmaster Formula Indicator for MT4 and MT5
  • Tools:

    Currency Heat Map

    Categories

    • Analysis
    • News

    Archives

    • January 2024
    • December 2023
    • November 2023
    • October 2023
    • September 2023
    • August 2023
    • July 2023
    • June 2023
    • May 2023
    • August 2020
    • June 2020
    • May 2020
    • April 2020
    • January 2020
    • December 2019
    • November 2019
    • October 2019
    • September 2019
    • August 2019
    • July 2019
    • June 2019
    • May 2019
    • April 2019
    • March 2019
    • February 2019
    • January 2019
    • December 2018
    • November 2018
    • October 2018
    • September 2018
    • August 2018
    • July 2018
    • June 2018
    • May 2018
    • March 2016
    • December 2015
    • November 2015
    • October 2015
    • August 2015
    • July 2015

    Disclaimer

    This website should be used for general information purposes only and in no way represents professional financial advice.

    Forex and CFD trading carries a high level of risk and it is possible to lose more than your initial deposit if using leveraged products.

    Copyright © 2025 · eleven40 Pro Theme on Genesis Framework · WordPress · Log in

    • About
    • Contact
    • Disclosure
    • Privacy Policy
    • Terms Of Service