The Forex Chronicles

  • Rebates
  • Brokers
  • News
  • Analysis
  • Signals
    • Best Copy / Social Trading Platforms
    • eToro Review
    • FXTM Invest Review
    • Marketclub Review
    • ZuluTrade Review
  • Indicators
  • Strategies
  • Articles

Archives for March 2019

eToro Trading Update – March 2019

March 28, 2019 by James Woolley Leave a Comment

Not A Good Month

There was a time at the start of the month when the portfolio was in really excellent shape. I banked some small short-term profits on various stocks, sold a few of my longer-term holdings for a decent profit, such as Apple, for example, and my largest holding, GVC, was now nicely into profit when it was trading above 700p.

However the trouble is that if you invest too much into one stock, and that company announces some bad news that sends the share price tumbling, your portfolio can take a big hit, and that’s exactly what happened.

After a positive trading update from GVC, there was an RNS shortly afterwards announcing that both the chairman and the CEO sold a large number of their shares at a discount, which caused many investors to sell their shares in the fear that there was some bad news on the horizon, and encouraged traders to open short positions.

Subsequently the price has gone from over 700p to just over 500p, but the good news is that the CEO has announced that he won’t be selling any more shares, and has hinted that the company is still in good shape, which has helped the price recover to around 550p.

To be fair, I have a few other stocks in my portfolio that are down a little since I bought them, so this too has contributed to a fall in the overall value of my portfolio.

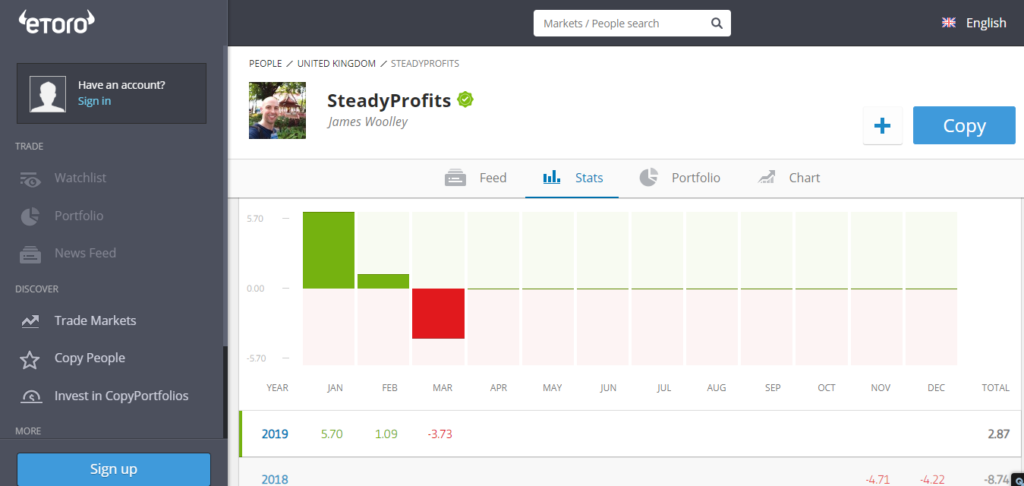
The net result of all this is that the portfolio is now down 3.73% for the month of March with two full trading days left.

SteadyProfits eToro Performance Chart for March 2019

Trading Summary / Dividends

With regards to my trading activity this month, I sold both of my holdings in Barclays (BARC.L) that I bought last month for a decent profit (plus I also received the dividend as well during this time).

I also took the opportunity to sell about 30% of my GVC (GVC.L) shares when the price got to 722p. With the benefit of hindsight, I wished I had sold all of my GVC shares because the price subsequently fell sharply, but I am still a firm believer in this company and based on future forecasts, it should still be trading around 700-800p at the very least in the future.

For that reason, I ended up buying some more shares at 587p, and received a healthy dividend when the shares went ex-dividend on 14 March.

In addition to this, I sold my shares in Domino’s Pizza (DOM.L) for a very small profit when the opportunity arose because I wasn’t really comfortable with my initial entry price, and then traded it again when the price dropped for a bigger profit.

I also sold my shares in Apple (AAPL) for an excellent profit at around $181.63. I was intending to hold on to them in the hope that they would reach $200, but I decided to bank some profits instead.

Finally, I also managed to bank a profit of around 3.73% trading Aviva (AV.L), so in terms of trading it was a good month, but GVC and a few long-term investments have pushed the overall value lower this month.

Current Portfolio

At this moment in time, GVC is still my largest holding, closely followed by International Airlines Group (IAG.L), which is ridiculously undervalued based on future forecasts and is due to pay a massive dividend later this year.

The rest of my portfolio is made up of financial stocks, similar to Warren Buffet, and includes Aviva (AV.L), Barclays (BARC.L) and HSBC (HSBA.L), all of which are very cheap based on fundamentals and pay an excellent dividend.

Closing Comments

Overall I am obviously disappointed with the whole GVC situation (I don’t think the directors realised how much of an affect their share sales would have on the share price) and the overall performance of my portfolio this month, but as my eToro username (SteadyProfits) suggests, my goal is to make steady profits over time, and I am 100% confident that the GVC share price will slowly recover and the other stocks in my portfolio will start to come good.

In the meantime I am more than happy to keep on accumulating dividends and reinvesting them into good quality high-dividend stocks. It’s all about being patient and reinvesting both profits and dividends, and if I keep on doing this, I’m sure that my portfolio will eventually be in really good shape.

Follow Me on eToro

If you would like to follow my journey on eToro, simply go to the eToro website and search for SteadyProfits to view my live trading results and to see my latest trades.

Past performance is not an indication of future results. This content is for information and educational purposes only and should not be considered investment or portfolio management advice. 81% of retail investor accounts lose money when trading CFDs with this provider.

Filed Under: News Tagged With: etoro, steadyprofits

The AUD/NZD Pair is Still Looking Weak in March 2019

March 19, 2019 by James Woolley Leave a Comment

Aussie Dollar Weakness

The Australian dollar has really struggled against the New Zealand dollar in recent months. Back in January I posted about the long-term weakness of this particular pair, and pointed out that it was in a strong downward trend on pretty much every single time frame, including the monthly, weekly, daily and 4-hour time frame.

Well nothing much has changed because if you look at exactly the same time frames on a single screen, it is clear that this pair is still in a very strong downward trend.

The price is actually lower now than it was in my previous post, which indicates that the long-term downward trend is still in place, and if you look at the price in comparison to the 20, 50, 100 and 200-day moving averages, you can see that it is still below all of these indicators on the monthly, weekly, daily and 4-hour chart:

AUDNZD Price Charts - March 2019

Future Price Direction

The AUD/NZD is still not really showing any signs of strength or recovery, and has actually just started to turn downwards once again on the lower time frames, ie the daily and 4-hour chart, which is why I thought it was worth mentioning it in a new blog post.

At the time of writing, the price has moved back towards the EMA (20) on the daily chart, but has fallen back today, and has just crossed below the EMA (20) on the 4-hour chart.

Therefore the likelihood of a recovery in the short-term is looking less and less likely, and it is looking more likely that the price will continue falling.

It recently fell below 1.03 last week, and I think it could easily test this level once again, and possibly go a little lower before we see any potential recovery.

Long-Term Prediction

You would have to think that the long-term weakness in the AUD/NZD cannot continue forever. At some point the Aussie dollar should start to strengthen against the New Zealand dollar.

Looking at the monthly and weekly charts, it wouldn’t be at all surprising to see the price move back towards the 100 and 200-period moving averages at around 1.07-1.08 in the medium-term, and up to 1.11 looking further ahead.

However as I always say, these are just my own thoughts and opinions, and this is no way should be seen as professional trading or financial advice. You should always do your own research and make your own decisions when trading the forex markets.

Filed Under: Analysis Tagged With: audnzd

FTSE and Dow Jones Continue to Trade Sideways in March 2019

March 14, 2019 by James Woolley Leave a Comment

Introduction

As someone who trades both UK and US stocks on the eToro platform (profile = SteadyProfits), I am all too aware of how little movement there has been just recently on the major UK and US stock markets.

If you look at the daily chart of the FTSE 100 index below, you will see that it appears to have stabilized in the 7100s, having continuously traded between 7100 and 7200, and there is no real momentum to take it higher or lower at the current time.

FTSE 100 Chart - 14 March 2019

Indeed the last time it closed outside of this 100-point trading range was as long ago as 1 March. The price just doesn’t seem to want to move away from the 100 or 200-day moving average at the moment.

This is almost certainly due to all of the uncertainty surrounding Brexit because the markets are waiting to see what will happen on 29 March. The threat of a no-deal Brexit appears to be receding, with an extension almost inevitable, but there is the growing threat of a second referendum, which could result in Brexit being cancelled altogether.

However it is not just the UK market that has been trading in a sideways trading range this month because the Dow Jones has also been trading sideways with no real direction, as you can see below:

Dow Jones Chart - 14 March 2019

After bouncing back from its December lows, the price has risen above its long-term moving averages, ie the 100 and 200-day EMA, and is trading just below its highs from last month at around 25,700.

Trading Opportunity

So what does all this mean from a trading point of view?

Well at the moment it is hard to enter any trades with any real confidence, and if these two markets were to test their highs again, it would be hard to justify a major breakout to the upside at the moment with everything that is going on with Brexit and China.

Indeed even if there was some clarity with regards to Brexit, it would still be hard to predict how the FTSE 100 is going to react to this news. That’s because even though it would be natural to assume the FTSE 100 index would move strongly upwards if Brexit was delayed or even cancelled, the strengthening of the £ could actually cause the index to fall because many of the largest FTSE 100 companies report their earnings in US dollars, which would obviously be weaker.

So I think it is better to wait for any news first of all, and then wait for a decisive breakout. As I said, I wouldn’t necessarily be confident about trading an upward breakout, but if the price were to fall below the long-term moving averages with a downward moving average crossover, there could potentially be a lot of potential downside, and this would probably be a higher probability trading opportunity.

Anyway these are just my own thoughts and opinions. As always, this does not represent professional trading or financial advice. You should always do your own research before entering any trades.

Filed Under: News Tagged With: dow jones, ftse 100

Gold Breaks Below $1300 – March 2019

March 4, 2019 by James Woolley Leave a Comment

Introduction

With the major stock markets surging higher in 2019, I think many people naturally assumed that the price of gold would struggle to stay above $1300. I know I certainly did because I made this exact point in previous blog posts.

Well it has taken a while because the price of gold headed to around $1345 a few weeks ago, but it has since fallen back sharply and is now trading below $1300 at around $1293.5 at the time of writing.

Indeed this was apparently the biggest weekly decline since August 2018, which shows just how strong a move this actually was last week.

It is not an insignificant move either because if you look at the long-term daily chart below, you can see that it has broken below the upward trendline that has been in place since November last year:

Gold Daily Chart - 4 March 2019

The question is; where does it go from here?

Future Price Direction

It is actually very difficult to call this market right now because it largely depends on what the stock markets do in the coming weeks, and these too are difficult to call.

With Britain scheduled to leave the European Union at the end of this month, and Donald Trump’s comments and actions continuing to weigh heavily on the markets, nobody can really be sure if the markets are going to continue to move higher in the future, or whether they will finally start to run out of momentum and fall back.

Brexit alone is causing so much uncertainty because it is looking increasingly unlikely that there will be a firm resolution before the official exit date, and the USA’s future relationship with China and other countries isn’t any clearer.

So all we can really do is to rely on technical analysis to guide us with regards to the gold price, and in that respect you would have to say that gold may well struggle to break back above the $1300 level now that it has broken below this significant round number.

Looking further ahead, further weakness is likely and I would say that there is every chance that the price will move towards the 200-day exponential moving average at some point, which currently stands at around $1268.

Trading Opportunity

Although I am predicting further weakness below $1300, I wouldn’t necessarily say that this is a strong trading opportunity right now because it doesn’t really represent a high-probability trade.

With gold and other commodities, I think it is better to wait for a period of consolidation where the markets are range-bound for several weeks, and then trade the resulting breakout, similar to what we saw at the January when the price rocketed above $1300 after several weeks of sideways movement.

So it is probably better to wait and see if the price stays around the 1290-1300 level for several days because if this occurs, then a downward breakout could be a very profitable trade.

Filed Under: News Tagged With: gold, gold price

Forex Rebates:

Choose from 40+ different forex brokers and crypto exchanges, and get cashback every time you trade:


Copy Profitable Traders:

If you join ZuluTrade, you can follow and subscribe to profitable traders and all of their trades will be automatically copied in your own trading account.

You can also earn money as a signal provider if you are already a profitable trader.

Click here to find out more

Recommended Broker:

Recent Blog Posts:

  • High Probability Trade on S&P 500 – 26 January 2024
  • Oanda Moves Into Prop Trading With Labs Trader Program
  • My eToro Performance in 2023 – Up 33.24%
  • The5ers Offering $20K Bootcamp Challenge For Just $1
  • Example of VWAP Bounce Trade on S&P 500 – 18 December 2023

Recent Articles:

VWAP Indicator
  • MA Sabres (LuxAlgo) Indicator
  • 10 Harsh Truths About Forex Trading
  • Best Websites for Monitoring Currency Strengths
  • Xmaster Formula Indicator for MT4 and MT5
  • Tools:

    Currency Heat Map

    Categories

    • Analysis
    • News

    Archives

    • January 2024
    • December 2023
    • November 2023
    • October 2023
    • September 2023
    • August 2023
    • July 2023
    • June 2023
    • May 2023
    • August 2020
    • June 2020
    • May 2020
    • April 2020
    • January 2020
    • December 2019
    • November 2019
    • October 2019
    • September 2019
    • August 2019
    • July 2019
    • June 2019
    • May 2019
    • April 2019
    • March 2019
    • February 2019
    • January 2019
    • December 2018
    • November 2018
    • October 2018
    • September 2018
    • August 2018
    • July 2018
    • June 2018
    • May 2018
    • March 2016
    • December 2015
    • November 2015
    • October 2015
    • August 2015
    • July 2015

    Disclaimer

    This website should be used for general information purposes only and in no way represents professional financial advice.

    Forex and CFD trading carries a high level of risk and it is possible to lose more than your initial deposit if using leveraged products.

    Copyright © 2025 · eleven40 Pro Theme on Genesis Framework · WordPress · Log in

    • About
    • Contact
    • Disclosure
    • Privacy Policy
    • Terms Of Service