The Forex Chronicles

  • Rebates
  • Brokers
  • News
  • Analysis
  • Signals
    • Best Copy / Social Trading Platforms
    • eToro Review
    • FXTM Invest Review
    • Marketclub Review
    • ZuluTrade Review
  • Indicators
  • Strategies
  • Articles

Archives for April 2019

eToro Trading Update – April 2019

April 22, 2019 by James Woolley Leave a Comment

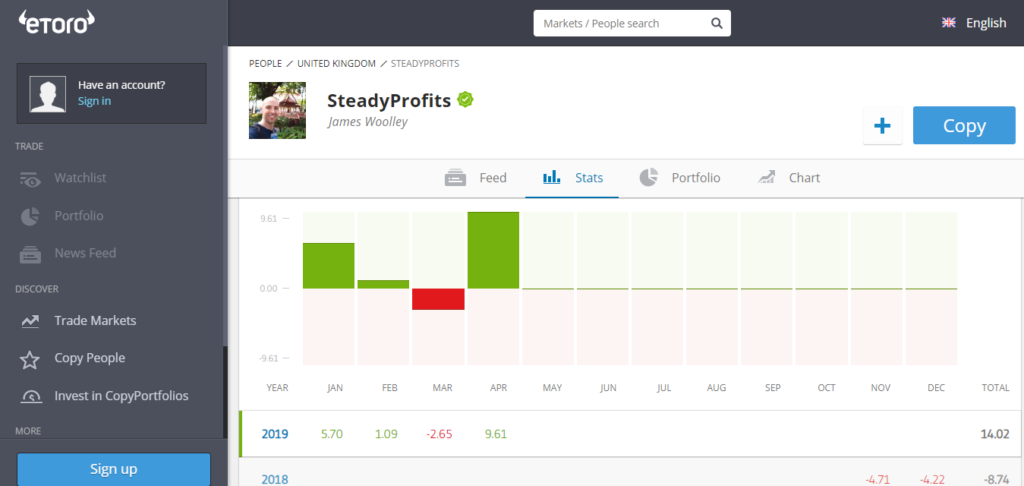
My Best Month Yet – Up 9.61%

It’s Bank Holiday Monday here in the UK and the markets will remain closed for one more day, so I thought this would be a good time to discuss my latest trading performance on eToro for the month of April (trader profile = SteadyProfits).

If you read last month’s update, you will know that my portfolio took a big dip after the share price of GVC (my largest holding) fell sharply from 700p to just over 500p.

This panic selling was all caused by both the chairman and the CEO selling a large amount of shares, but after a positive trading update earlier this month, it would appear that nothing is fundamentally wrong with the company, and they are still on course to continue growing their profits, which has helped to reassure investors.

This has resulted in the share price bouncing back to around 648p, and I’m sure that it will continue creeping back up towards the 700p level in due course.

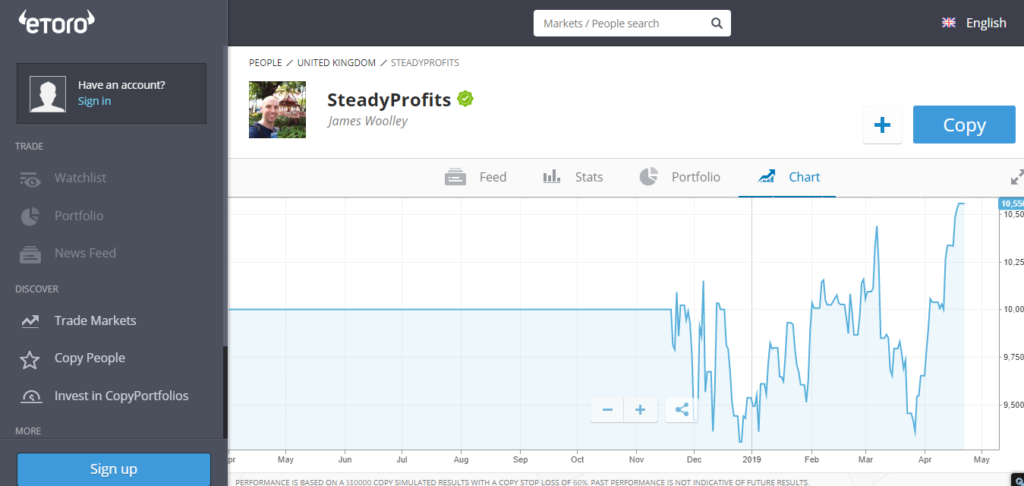
Furthermore, it has also meant that my portfolio is now in great shape once again. After falling 2.65% in March, the portfolio is currently up 9.61% so far this month (and is up 14.02% in 2019), which I am obviously delighted about.

SteadyProfits eToro Trading Results for April 2019

Trading Summary / Dividends

As mentioned above, one of the main reasons why my portfolio is up so much is because GVC has bounced back so strongly, but other stocks have contributed to this gain as well.

I currently have three other stocks in my portfolio – International Airlines Group (IAG.L), Barclays (BARC.L) and Aviva (AV.L), and these are all in profit at the moment, helped by a positive overall stock market performance, because they are up 0.24%, 5.07% and 1.87% respectively.

In addition to this, I also sold my two holdings in HSBC (HSBA.L) for a profit of around 1% in the hope that I will be able to get back in lower, and banked a nice dividend of around 4% (after fees) from my Aviva (AV.L) shares.

Apart from this, there hasn’t been much trading activity because I can’t really find a lot of undervalued stocks right now, but I have some capital ready to invest should the markets fall in the near future.

SteadyProfits eToro Performance Chart for April 2019

Copiers

Despite being up over 14% up this year, and over 5% up overall, I still don’t have any people actively copying my trades on eToro, which is a little disappointing.

It seems to be quite hard to get noticed on eToro, and I understand that many people are reluctant to copy traders who don’t have a long trading history.

However it would still be nice to have just one or two people copying my trades because I want to help other people make some extra money as well.

Closing Comments

As you can imagine, I am still very happy with my overall trading performance, particularly after seeing the portfolio fall in value last month.

In the future I would like to reduce my exposure to GVC a little, despite being very bullish about their future prospects, and diversify a little more into other stocks if the opportunities present themselves.

However I am still very happy with my overall portfolio because I bought some undervalued high-dividend stocks at some decent prices, and am content to collect the dividends whilst waiting for their respective share prices to rise.

Follow Me on eToro

If you would like to follow my journey on eToro, simply go to the eToro website and search for SteadyProfits to view my live trading results and to see my latest trades.

Past performance is not an indication of future results. This content is for information and educational purposes only and should not be considered investment or portfolio management advice. 81% of retail investor accounts lose money when trading CFDs with this provider.

Filed Under: News Tagged With: etoro, steadyprofits

GBP/USD Likely to Continue Trading Sideways After Brexit Delay

April 18, 2019 by James Woolley Leave a Comment

6-Month Brexit Delay

An agreement has recently been reached between the UK and the European Union for Britain’s official exit to be delayed until October 31.

This will come as welcome news to nearly half of the population who want to remain, and those people who still harbour hopes of a second referendum, but from a forex trading point of view, it is not exactly the best of news.

Implications for the GBP/USD Pair

The GBP/USD pair has been trading sideways for quite some time now, and so news of a Brexit stalemate is only going to increase the uncertainty surrounding the British economy, and subsequently the British pound.

Therefore it is highly likely to continue trading in a sideways trading range with no clear momentum or direction.

GBPUSD Daily Chart -18 April 2019

You can see from the daily price chart above that the trading range has actually been getting smaller and smaller in recent weeks as the original Brexit leaving date came and went.

Ordinarily this narrowing range would point to a possible breakout situation, and although it may well drop back to around the 1.28 level, it is hard to see the price moving strongly above 1.31 or strongly below 1.28 at the present time because there is unlikely to be any real news to drive the price in either direction in the immediate future.

Other GBP Pairs

The same can be said for many of the other British pound pairs as well.

Pairs such as the GBP/JPY are also starting to look a little weak, but unless there is a major breakthrough regarding the whole Brexit saga, it is hard to see what will drive the price of these pairs significantly higher or lower going forward.

Trading Opportunities

All of this means that from a trading perspective, it is going to continue to be very difficult to make consistent profits trading the British pound pairs because the average daily trading range is likely to remain relatively small, and there is unlikely to be any clear direction in the near future.

So it is probably a better idea to focus on those pairs that currently have a much larger average trading range and have more potential to trend strongly upwards or downwards in the weeks and months ahead.

One such pair is the AUD/NZD pair, for instance, which has been quite volatile in recent months and has some fairly consistent trends if you trade the daily time frame. This is obviously not affected by Brexit, which is exactly what you want right now.

Other good trading candidates that are not directly affected by Brexit include the USD/JPY and the USD/CAD pairs.

Finally, it is worth mentioning that you could also trade other markets that are trending strongly. The Dow Jones and the S&P 500 are always good markets to trade, as indeed are the crude oil markets, but you could also trade some of the cryptocurrencies or some of the other commodities if you don’t want to trade the British pound pairs. There are always plenty of options.

Filed Under: News Tagged With: brexit, gbpusd

Gold Chart Highlights Significance of Historical Trendlines

April 2, 2019 by James Woolley Leave a Comment

Gold Price Action

If you look at the long-term daily chart of gold, you will see that the price has been steadily rising upwards since the end of 2018.

As you can see from the chart below, the trendline marking the two lowest points at the start of this move has been a good guide because the price stayed above this trendline for many weeks and months and never really threatened to go below this line.

Gold Price Chart - 2 April 2019

Indeed the price crossed above the 200-day exponential moving average, as did the 20, 50 and 100-day moving averages, highlighting a very strong upward move.

The price actually reached a high of around $1346, but it has since fallen below this trendline, but the interesting thing is that this trendline is now acting as resistance.

Trendline Resistance

This occurs quite often in the financial markets. A trendline that previously acted as support is now acting as resistance, and the reason why is because traders and financial institutions are always looking for strong areas of support or resistance to place their trades, and this is one such example.

In this case, after breaking below the initial trendline, the price has bounced back on several occasions, but has struggled to move above this extended trendline. In fact on every occasion gold has been sold off whenever it has come close to this line.

Subsequently the upward momentum finally subsided and the price is now back below the critical $1300 level at $1287.

Future Price Direction

It is quite hard to predict where the price is going to go from here, but you would have to say that it is more likely to continue falling further below $1300, particularly if the general stock markets remain strong.

The trendline is likely to continue acting as resistance if the price does bounce back, and at the current time, it is hard to see what kind of economic factors are going to drive the price above this level.

Furthermore, the 200-day moving average is starting to become significant once again because the price is only just above this key indicator.

If it were to fall below this moving average and was backed by strong volumes, then there could be a much more sustained downwards move, with price targets of $1260, $1240 and $1220 being easily achievable in the short-medium term.

Anyway the key point I wanted to make is that historical trendlines can be very significant when you are looking for areas of support and resistance, and this is a classic example of one such instance.

Filed Under: Analysis Tagged With: gold, gold price

Forex Rebates:

Choose from 40+ different forex brokers and crypto exchanges, and get cashback every time you trade:


Copy Profitable Traders:

If you join ZuluTrade, you can follow and subscribe to profitable traders and all of their trades will be automatically copied in your own trading account.

You can also earn money as a signal provider if you are already a profitable trader.

Click here to find out more

Recommended Broker:

Recent Blog Posts:

  • High Probability Trade on S&P 500 – 26 January 2024
  • Oanda Moves Into Prop Trading With Labs Trader Program
  • My eToro Performance in 2023 – Up 33.24%
  • The5ers Offering $20K Bootcamp Challenge For Just $1
  • Example of VWAP Bounce Trade on S&P 500 – 18 December 2023

Recent Articles:

VWAP Indicator
  • MA Sabres (LuxAlgo) Indicator
  • 10 Harsh Truths About Forex Trading
  • Best Websites for Monitoring Currency Strengths
  • Xmaster Formula Indicator for MT4 and MT5
  • Tools:

    Currency Heat Map

    Categories

    • Analysis
    • News

    Archives

    • January 2024
    • December 2023
    • November 2023
    • October 2023
    • September 2023
    • August 2023
    • July 2023
    • June 2023
    • May 2023
    • August 2020
    • June 2020
    • May 2020
    • April 2020
    • January 2020
    • December 2019
    • November 2019
    • October 2019
    • September 2019
    • August 2019
    • July 2019
    • June 2019
    • May 2019
    • April 2019
    • March 2019
    • February 2019
    • January 2019
    • December 2018
    • November 2018
    • October 2018
    • September 2018
    • August 2018
    • July 2018
    • June 2018
    • May 2018
    • March 2016
    • December 2015
    • November 2015
    • October 2015
    • August 2015
    • July 2015

    Disclaimer

    This website should be used for general information purposes only and in no way represents professional financial advice.

    Forex and CFD trading carries a high level of risk and it is possible to lose more than your initial deposit if using leveraged products.

    Copyright © 2025 · eleven40 Pro Theme on Genesis Framework · WordPress · Log in

    • About
    • Contact
    • Disclosure
    • Privacy Policy
    • Terms Of Service