The Forex Chronicles

  • Rebates
  • Brokers
  • News
  • Analysis
  • Signals
    • Best Copy / Social Trading Platforms
    • eToro Review
    • FXTM Invest Review
    • Marketclub Review
    • ZuluTrade Review
  • Indicators
  • Strategies
  • Articles

Archives for August 2019

GBP/USD Analysis August 2019 – Key Levels to Watch

August 27, 2019 by James Woolley Leave a Comment

Recent Price Action

The British pound has slumped against many of the major forex pairs as the threat of the UK leaving the European Union without a deal has only increased with every passing day.

However looking at the price charts of many of the pound pairs, the price does seem to have stabilized around the current levels, and may even be showing signs of bottoming out.

So in this article I thought I would take a closer look at the GBP/USD pair in particular because this has really fallen quite substantially in recent months, and have attempted to identify some key levels that may be worth watching in the coming days and weeks.

Key Levels on Daily Chart

Looking at the daily chart first of all, the price is currently trading a long way below it’s 200-day moving average, so there is plenty of scope for the price to rise and move back towards this key level.

The 200-day EMA currently stands at 1.2731 at the time of writing, but if there is to be an upward breakout, we really need to see the price close above 1.2327 because this is the current level of the Supertrend indicator, which has been indicating a bearish trend since 15 May 2019.

GBPUSD Daily Chart August 2019

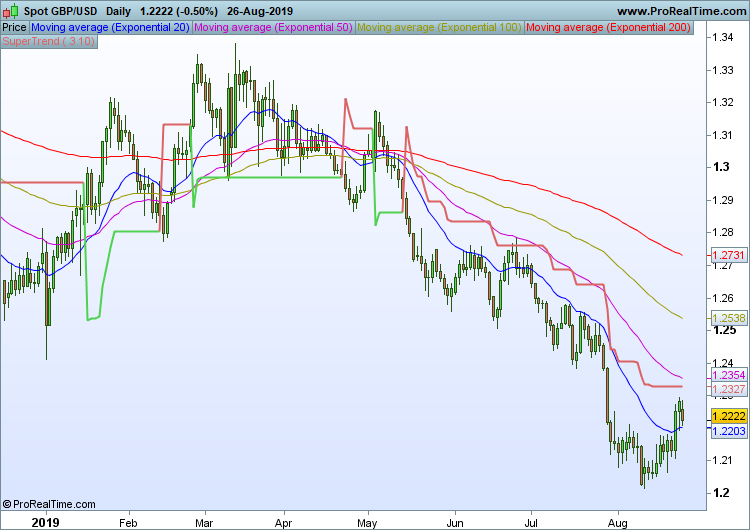
Until that happens, the price is likely to continue trading in a narrow range between 1.20 and 1.22 until the whole Brexit situation is a lot clearer.

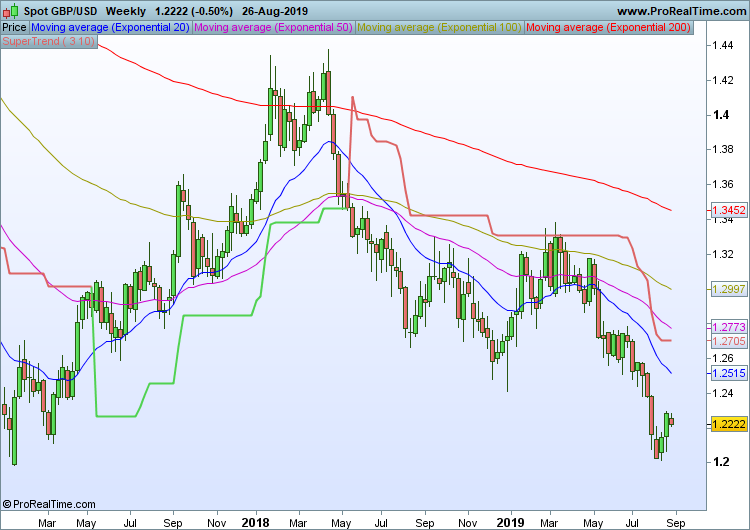
Key Levels on Weekly Chart

Moving on to the weekly chart, the price is also a long way below the Supertrend indicator, which has also been bearish since May, and currently stands at 1.2705.

So I think if we are to see a longer-term bullish trend on the GBP/USD the price is going to have to close above this level because this is currently acting as a strong resistance level, and realistically this is unlikely to happen any time soon.

The only likelihood of the GBP/USD closing above 1.2705 on a weekly basis is if there is some kind of agreement in place between the UK and the EU, but as I say, this is highly unlikely at the present time.

GBPUSD Weekly Chart August 2019

Final Thoughts

I think a lot of traders are keen to look for possible long positions on the GBP/USD pair simply because it has fallen so much this year, but it is pointless taking a position based on a dead cat bounce, or speculating that an agreement will be reached.

It is better to either wait for some news regarding a Brexit agreement, or if you do insist on trading, watching some of the key levels mentioned above to see if they are breached.

However my personal view is that it is not worth getting involved with any medium to long-term trades on this or any other British pound pair until after the October 31 deadline, or until an agreement is reached, whichever happens sooner.

I think the GBP may well bounce back in time even if the UK crashes out without a deal, but at the moment the GBP/USD is simply too risky to trade with any real certainty.

Filed Under: Analysis Tagged With: gbpusd

AUD/USD Analysis August 2019 – Long-Term Breakout Confirmed

August 19, 2019 by James Woolley Leave a Comment

Previous Trading Range

If you read my previous blog post that I wrote about the AUD/USD pair last month, you will know that I talked about a potential long-term breakout that could be about to take place on this particular currency pair. Here is the original price chart:

AUDUSD Long Term Downward Trend 2019

The price had been trading within a clearly defined trading range for the whole of 2019, and so it seemed like it was only a matter of time before the price broke strongly upwards or downwards out of this range.

July / August Breakout

I actually thought that we would eventually see an upward breakout, but as you can see from the daily price chart below, the price actually broke lower, and more importantly, closed below the lower trendline on the last month of July.

AUDUSD Breakout July August 2019

Subsequently, the momentum of this breakout helped to drive the price lower into August, hitting a low of around 0.6677 on 7 August before bouncing back.

I said in my previous blog post that I think the price may find support at the previous low, which was caused by the flash crash back in January, and this proved to be correct because although the price did go slightly lower than this on an intraday basis on 7 August, it soon found strong support at this level and bounced back towards 0.68.

Future Direction

After finding support at the previous low, it is hard to argue that the price of the AUD/USD is likely to continue falling much more.

This is a long established downward trend, but after the previous breakout and the subsequent rebound, it is starting to look like it is close to the bottom now.

Therefore I would say that in the near future at least, the price is likely to move back towards its 200-day moving average, which is currently just above the 0.70 level, and back into its previous trading range.

After that, the previous downward trend could prevail and the price could easily fall again, or we could finally see the start of a new upward trend, but for that to happen we really need to see the price close strongly above the 200-day exponential moving average.

If the short-term moving averages cross above this indicator as well, then there could well be a longer sustained upward move in the future.

Final Thoughts

The point I wanted to make is that it can be very profitable to wait for these breakouts to occur, particularly when a pair has been trading in a clearly defined trend for many months, as was the case here.

In this instance you could have banked up to 172 points if you had entered a short position at the close of the breakout candle and closed at the lowest point on 7 August.

Of course the hard part is deciding when to close because it is virtually impossible to get out at just the right time, but there were still plenty of opportunities to make money because you could have set your price target at 50, 100 or 150 points, for instance, which were all realistic targets, or closed incrementally as the price continued to fall.

These breakouts require a lot of patience because the price may be stuck in a trading range for many months, but when they occur, they can be very rewarding.

Filed Under: Analysis Tagged With: audusd, breakout

The Crypto 10 Index

August 13, 2019 by James Woolley Leave a Comment

Introduction

Cryptocurrencies have exploded in popularity in recent years as more and more people learn more about them, and see the potential of these digital / virtual currencies in the years ahead.

As a result of this, some speculators inevitably want to try and make some money by either investing in or trading these cryptocurrencies, whether it’s one of the most popular cryptocurrencies such as Bitcoin, or whether it’s one of the newer relatively unknown ones that has a lot more potential to explode in value.

It is now relatively easy to buy one or more of these cryptos online, but if you are unsure which one has the most potential, or if you are just bullish about the prospects of all the major cryptos, you may be interested to know that there is now a Crypto 10 index that you can trade that includes the 10 most popular cryptocurrencies.

History / Performance

This index was originally launched a few years back as far as I understand, and at the time of writing it is currently up 58.16% since the start of the year, demonstrating the renewed strength and bullishness of the general cryptocurrency market in recent months.

Crypto 10 Index Weekly Chart

Crypto 10 Index Cryptocurrencies

As I said earlier, this index includes ten of the largest and most actively traded cryptocurrencies in terms of market capitalization, all of which are listed below:

  • Bitcoin
  • Ethereum
  • Ripple
  • Litecoin
  • Bitcoin Cash
  • EOS
  • Bitcoin SV
  • Cardano
  • Monero
  • Dash

It is a weighted index which means that the larger cryptos will influence the price movement of the index a lot more that the smaller ones, but it will still give you exposure to many of the most popular cryptos in the world without having to buy any of them individually.

Where to Trade the Crypto 10 Index

I first learned about this particular index on IG.com, and have actually added it to my shortlist and been tracking its price movement ever since, but I understand that it is also possible to trade this index through Plus 500 as well.

It is worth noting that as well as being able to open long positions, you can also enter short positions if you feel that many of the major coins are overvalued and likely to fall in the near future, which gives you a lot more options as a trader.

Final Thoughts

It should be pointed out that this is not the only index that groups together many of the most popular cryptocurrency tokens. You will find that some brokers have developed their own indexes that enables their customers to buy or sell a large basket of cryptocurrencies.

However I just thought I would bring it to your attention because I know that many of my readers like to trade with IG, and a few people have asked me if there are any indexes or ETFs that include all of the most popular tokens collectively. So hopefully you will find this article useful.

Please remember that cryptocurrencies are highly speculative, and it is possible to lose all of your capital.

Filed Under: News Tagged With: bitcoin, crypto 10, cryptocurrencies

Forex Rebates:

Choose from 40+ different forex brokers and crypto exchanges, and get cashback every time you trade:


Copy Profitable Traders:

If you join ZuluTrade, you can follow and subscribe to profitable traders and all of their trades will be automatically copied in your own trading account.

You can also earn money as a signal provider if you are already a profitable trader.

Click here to find out more

Recommended Broker:

Recent Blog Posts:

  • High Probability Trade on S&P 500 – 26 January 2024
  • Oanda Moves Into Prop Trading With Labs Trader Program
  • My eToro Performance in 2023 – Up 33.24%
  • The5ers Offering $20K Bootcamp Challenge For Just $1
  • Example of VWAP Bounce Trade on S&P 500 – 18 December 2023

Recent Articles:

VWAP Indicator
  • MA Sabres (LuxAlgo) Indicator
  • 10 Harsh Truths About Forex Trading
  • Best Websites for Monitoring Currency Strengths
  • Xmaster Formula Indicator for MT4 and MT5
  • Tools:

    Currency Heat Map

    Categories

    • Analysis
    • News

    Archives

    • January 2024
    • December 2023
    • November 2023
    • October 2023
    • September 2023
    • August 2023
    • July 2023
    • June 2023
    • May 2023
    • August 2020
    • June 2020
    • May 2020
    • April 2020
    • January 2020
    • December 2019
    • November 2019
    • October 2019
    • September 2019
    • August 2019
    • July 2019
    • June 2019
    • May 2019
    • April 2019
    • March 2019
    • February 2019
    • January 2019
    • December 2018
    • November 2018
    • October 2018
    • September 2018
    • August 2018
    • July 2018
    • June 2018
    • May 2018
    • March 2016
    • December 2015
    • November 2015
    • October 2015
    • August 2015
    • July 2015

    Disclaimer

    This website should be used for general information purposes only and in no way represents professional financial advice.

    Forex and CFD trading carries a high level of risk and it is possible to lose more than your initial deposit if using leveraged products.

    Copyright © 2025 · eleven40 Pro Theme on Genesis Framework · WordPress · Log in

    • About
    • Contact
    • Disclosure
    • Privacy Policy
    • Terms Of Service