The Forex Chronicles

  • Rebates
  • Brokers
  • News
  • Analysis
  • Signals
    • Best Copy / Social Trading Platforms
    • eToro Review
    • FXTM Invest Review
    • Marketclub Review
    • ZuluTrade Review
  • Indicators
  • Strategies
  • Articles

Archives for September 2019

Bitcoin Update 27 September 2019 – Breakout Confirmed

September 27, 2019 by James Woolley Leave a Comment

Descending Triangle Breakout

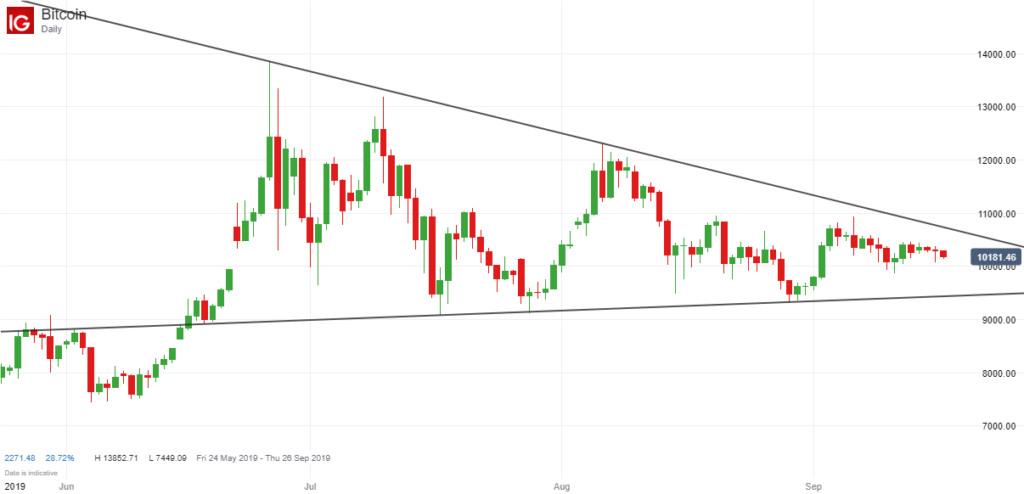
Last week I was discussing the descending triangle that had formed on the price chart of Bitcoin, and highlighted how it was trading in an ever decreasing trading range prior to a possible breakout.

Here is the chart from this previous blog post:

Bitcoin Trading Range in September

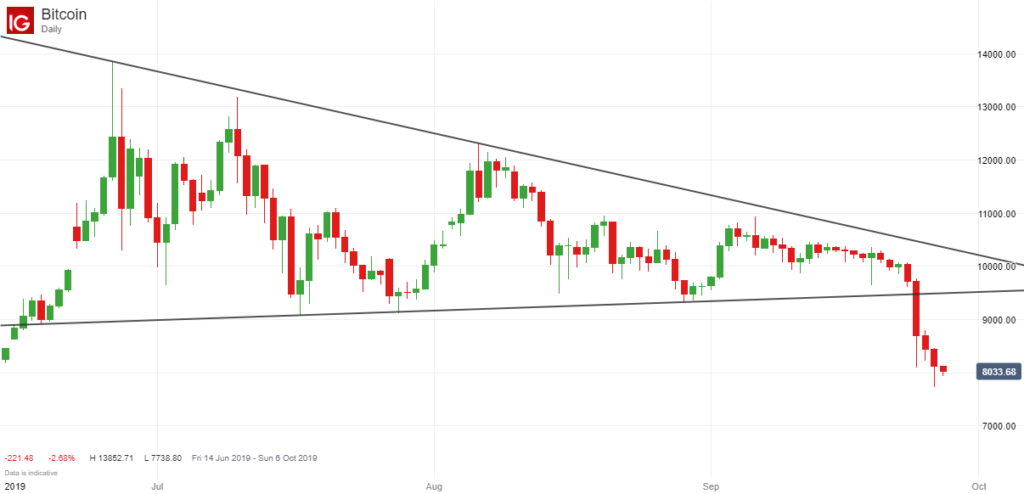
Well as expected, the price couldn’t stay in this trading range forever, and it eventually closed below this long-established trading range earlier this week, as you can see below:

Bitcoin Breakout - September 2019

8000 Level Breached

The closing price of the breakout candle was $8693, which is where many people will have opened a short position, and it was no real surprise that the price continued to fall in the following days.

That’s because many traders will have been watching this descending triangle for many months, and will have been waiting to trade any breakout that subsequently occurred.

The price of Bitcoin actually fell below the $8000 level to around $7739 before bouncing back to its current price of around $8050.

So the breakout could have yielded nearly $1000 x the initial stake per point for anyone brave enough to trade this breakout, and even exiting at $8000, which would have been an obvious exit point for many traders, would have generated a profit of $693 x stake per point (minus the spreads).

Disclaimer – Bitcoin and other cryptocurrencies are highly speculative instruments, and it is possible to lose all of your capital.

Of course this breakout is still very much in its infancy, so there is still every chance that the price could drop even lower than its recent low of $7739, generating even more profits for those traders who decided to trade this breakout.

Sentiment

It is often interesting to look at market sentiment for any given market to see how bullish or how bearish traders are in general, and looking at the Bitcoin market on IG.com, 83% of clients with open positions are expecting the price to rise, and 17% are expecting the price to fall.

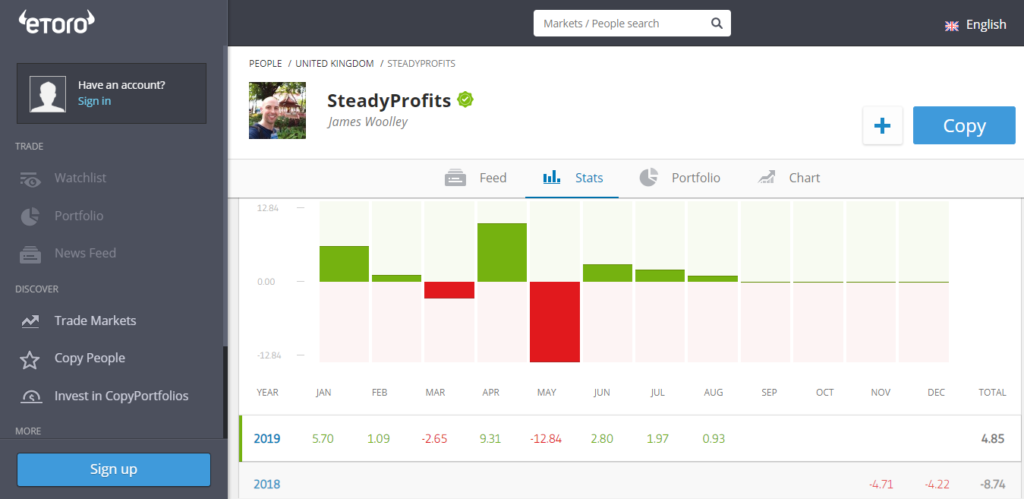
On eToro 98% of customers are buying Bitcoin at the time of writing, so these two stats would suggest that people are still very bullish on the long-term prospects of Bitcoin despite this downward breakout.

Final Thoughts

As I mentioned before, I don’t actually trade cryptocurrencies myself because of the risks attached and the relatively large spreads, but it is clear that these markets still conform very well to technical analysis because this was a textbook descending triangle breakout that has already yielded an excellent profit and may still fall even further.

With regards to future price predictions, I said in my last post that $8000 was within reach if there was a downward breakout and this has already been taken out. So I’m not really sure how much further it can fall in the near term.

It may well find a base at this new level and start to bounce back, or it could easily drop below $7000 if we have a few days where it closes below the psychological $8000 level. Either way, it should be interesting to watch.

Filed Under: News Tagged With: bitcoin, breakout

Descending Triangle on Bitcoin – September 2019

September 17, 2019 by James Woolley Leave a Comment

Bitcoin Price Action

Bitcoin has had a pretty crazy ride over the last few years. After surging higher to around $20,000, the price subsequently dropped all the way back to around $3150, and is now sitting somewhere in the middle of these two extremes at around $10,200.

If you look at the daily price chart of this particular cryptocurrency, you can see that there is a real air of uncertainty surrounding it right now:

Bitcoin Descending Triangle - September 2019

You can see from the trendlines marking the high and the low points that the price has been trading in a descending triangle in recent months, which basically means that it has been trading in an ever decreasing trading range.

The significance of this is that when the price of Bitcoin eventually breaks out of this descending triangle, which it has to do at some point, there is likely to be a strong breakout either upwards or downwards.

Breakout Price Targets

If there is to be an upward breakout, the price of Bitcoin is going to need to move strongly above $10,600, and close decisively above the upper trendline.

Similarly, if there is to be a downward breakout, the price is probably going to need to close below $9500 based on the current trendline level.

With regards to price targets, it is almost impossible to predict how far the price of Bitcoin could go, regardless of which direction the breakout is.

You would think that $8000 would be easily within range if there is a downward breakout, while the price could easily test the previous highs of 2019, and possibly push on even further to $15,000 and beyond if there is an upward breakout.

Final Thoughts

The point is that although Bitcoin seems to be fairly dead right now in terms of daily price movements, it could soon kick into life if the price breaks out of this descending triangle.

You can be sure that many traders and analysts are aware of this triangle and are eagerly anticipating a possible breakout, and so when there is a big price move in either direction, there is likely to be a lot of momentum behind any breakout.

I myself am not really a trader of cryptocurrencies, but I just thought I would alert people to this particular trading pattern because these descending triangle breakouts can be very profitable when they occur.

Please remember that Bitcoin and other cryptocurrencies are highly speculative instruments, and it is possible to lose all of your capital.

Filed Under: Analysis Tagged With: bitcoin, breakout, descending triangle

Double Pin Bar on USD/CAD at Start of September

September 9, 2019 by James Woolley Leave a Comment

Introduction to Pin Bars

I was listening to a podcast over the weekend and one of the traders being interviewed said that despite having about three core strategies that she likes to use, it is the simple pin bar that often provides her with the best signals.

To remind you, a pin bar is essentially where you have a long candlestick with a very small body, and when you get these pin bars towards the end of an upward or downward trend, it often signals that the trend is running out of momentum and likely to reverse.

One pin bar by itself often provides a very good trend reversal signal, but when you get two pin bars together, it is often a very strong signal that the trend is coming to an end.

Real-Life Example From USD/CAD Pair

I was reminded of this just recently when I was looking at the daily chart of the USD/CAD pair. As you can see below, the price has been recovering strongly since the middle of July, and has recently crossed above the 200-day moving average:

USDCAD Double Pin Bar - September 2019

More significantly, it also threatened to break even higher last week after being stuck in quite a narrow trading range for a number of weeks, but after posting two new highs on consecutive days, the price fell back down on both occasions and ended up forming a pin bar on both days.

Trading Opportunity

As a result of this double pin bar formation, there was a good opportunity to place an order to open a short position a few pips below the lowest point of these two pin bars at around 1.3310 to catch any reversal, and as it turned out, this would have been a very profitable trade.

At the time of writing, the USD/CAD is trading at around 1.3150, which equates to around 160 points profit if you had entered a short position just below the lowest point of the two pin bars.

Final Thoughts

The point of this article was not simply to highlight a profitable set-up that you might have missed. It was to demonstrate how profitable these double pin bar set-ups can be when they actually occur.

Unfortunately they don’t tend to occur very often, so you won’t necessarily be able to trade these high-probability set-ups several times a month, for example, but it is worth keeping an eye out for them, particularly on the longer time frames when the odds of success are so much higher.

What I like about pin bars, and double pin bars in particular, is that there is an obvious place to place your stop loss – a few pips above the highest point of the two pin bars, as in this case, or a few pips below the lowest point in a downward trend.

The difficult part is trying to work out where you should take profits because sometimes you can get a large reversal, as was the case here with the USD/CAD pair, whereas other times the price may only move 10-20 pips before consolidating in the previous trading range or continuing its previous trend.

Therefore it could be argued that the best pin bar strategy is to close half the position for a small profit and let the other half run for as long as possible, but everyone will have their own methods of trading these high-probability set-ups. Ultimately you just have to find a strategy that works for you.

Filed Under: Analysis Tagged With: pin bar, usdcad

eToro Trading Update – August 2019

September 1, 2019 by James Woolley Leave a Comment

Modest Gains – Up 0.93%

The British summer is not usually a good time for stocks, and in fact they will often head lower on lower volumes at this time of the year.

So I am relatively happy to have seen the value of my eToro portfolio rise by 0.93% this month, following on from slightly larger gains in both June and July.

Sadly the large falls actually occurred in May for me, but the portfolio is now looking much healthier, boosted by some nice dividends and improved share price performance for many of my holdings.

As you can see from the image below, my eToro trading account (account name = SteadyProfits) is now up 4.85% in 2019:

SteadyProfits eToro Stats - August 2019

Dividends Received

August was a very good month in terms of dividends because three of my four main share holdings went ex-dividend this month, and because eToro pay dividends into your account on the ex-dividend date, I have already received all of these dividends.

The companies that went ex-dividend were Aviva (AV.L), GVC (GVC.L) and Imperial Brands (IMB.L).

Trading Performance / Current Portfolio

In terms of trading activity, it has again been quite a quiet month, mainly because I was fully invested most of the time, making it impossible to trade shorter term positions.

Nevertheless, at the very start of the month I did sell some of my Aviva shares that I had bought a few days previously for a profit of just over 2%, and after receiving dividends from GVC, I decided to sell a small portion of shares that I bought at 583.8p for 613.2p, for a profit of around 5%.

As a result of this, I am now going into September with around 12% in cash and around 88% invested in stocks. Ideally I would like to invest this cash into other stocks or sell some of my shares for a profit when the opportunity arises and then diversify more because I am too heavily invested in a small number of stocks right now.

At the moment I hold Aviva, GVC, Imperial Brands and International Airlines Group, and would be happy to buy more of any of these because they are all hugely undervalued at the moment.

However it is better to be more diversified and there are plenty of other stocks that are looking very cheap, such as Legal & General, Taylor Wimpey and Royal Dutch Shell, for example. So I shall be watching all of these other stocks very closely for an opportunity to buy.

Copiers

At the time of writing I still have no active copiers and I haven’t had any new followers in the last month, but I am not at all surprised by this.

I am not happy with the overall performance of my trading / investing account, even though it is up 4.85% this year, so I don’t expect others to be impressed by this either.

I am hopeful that the stocks that I am invested in will continue to recover throughout 2019, particularly once the Brexit mess is sorted out, and would like to see the portfolio up more than 10% before the end of the year, at which point people might be more inclined to copy and follow my account.

Final Thoughts

Anyone who is looking at my share portfolio may be alarmed to see some large falls of between 11.32% and 22.63%, but I am honestly not worried at all.

I have been an active share trader and investor for many years and have a long record of success with my significantly larger ISA account.

Furthermore, all of my stocks are undervalued and predicted to continue growing their profits in the coming years, and they all pay decent dividends in the meantime, so I am fully prepared to sit and wait for them all to recover no matter how long it takes.

If I have an opportunity to make some short-term trades with any leftover cash, I will try to do just that in order to boost the portfolio and give me some more money to reinvest.

Follow Me on eToro

If you would like to follow my journey on eToro, simply open an eToro account and search for SteadyProfits to view my live trading results and to see my latest trades.

Past performance is not an indication of future results. This content is for information and educational purposes only and should not be considered investment or portfolio management advice. 81% of retail investors accounts lose money when trading CFDs with this provider.

Filed Under: News Tagged With: etoro, steadyprofits

Forex Rebates:

Choose from 40+ different forex brokers and crypto exchanges, and get cashback every time you trade:


Copy Profitable Traders:

If you join ZuluTrade, you can follow and subscribe to profitable traders and all of their trades will be automatically copied in your own trading account.

You can also earn money as a signal provider if you are already a profitable trader.

Click here to find out more

Recommended Broker:

Recent Blog Posts:

  • High Probability Trade on S&P 500 – 26 January 2024
  • Oanda Moves Into Prop Trading With Labs Trader Program
  • My eToro Performance in 2023 – Up 33.24%
  • The5ers Offering $20K Bootcamp Challenge For Just $1
  • Example of VWAP Bounce Trade on S&P 500 – 18 December 2023

Recent Articles:

VWAP Indicator
  • MA Sabres (LuxAlgo) Indicator
  • 10 Harsh Truths About Forex Trading
  • Best Websites for Monitoring Currency Strengths
  • Xmaster Formula Indicator for MT4 and MT5
  • Tools:

    Currency Heat Map

    Categories

    • Analysis
    • News

    Archives

    • January 2024
    • December 2023
    • November 2023
    • October 2023
    • September 2023
    • August 2023
    • July 2023
    • June 2023
    • May 2023
    • August 2020
    • June 2020
    • May 2020
    • April 2020
    • January 2020
    • December 2019
    • November 2019
    • October 2019
    • September 2019
    • August 2019
    • July 2019
    • June 2019
    • May 2019
    • April 2019
    • March 2019
    • February 2019
    • January 2019
    • December 2018
    • November 2018
    • October 2018
    • September 2018
    • August 2018
    • July 2018
    • June 2018
    • May 2018
    • March 2016
    • December 2015
    • November 2015
    • October 2015
    • August 2015
    • July 2015

    Disclaimer

    This website should be used for general information purposes only and in no way represents professional financial advice.

    Forex and CFD trading carries a high level of risk and it is possible to lose more than your initial deposit if using leveraged products.

    Copyright © 2025 · eleven40 Pro Theme on Genesis Framework · WordPress · Log in

    • About
    • Contact
    • Disclosure
    • Privacy Policy
    • Terms Of Service