The Forex Chronicles

  • Rebates
  • Brokers
  • News
  • Analysis
  • Signals
    • Best Copy / Social Trading Platforms
    • eToro Review
    • FXTM Invest Review
    • Marketclub Review
    • ZuluTrade Review
  • Indicators
  • Strategies
  • Articles

Archives for November 2019

USD/JPY Analysis November 2019 – Downward Breakout Possible

November 25, 2019 by James Woolley Leave a Comment

Price Action

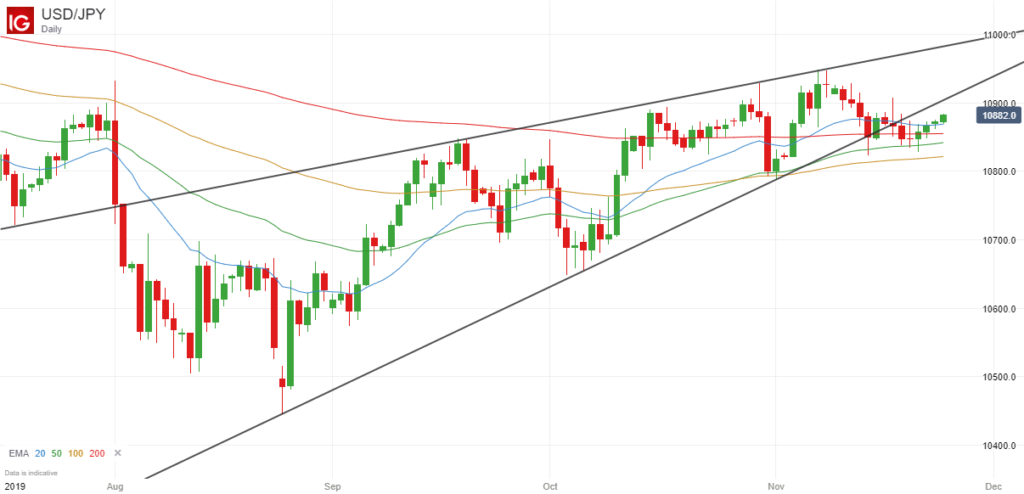
It has been interesting to watch the price action of the USD/JPY pair in recent months because after hitting a low of around 104.46 back in August, it has been slowly trending upwards since then, and currently trades at 108.80 at the time of writing.

Indeed as you can see from the price chart below, the price has bounced back so much, it has not only touched the 200-day exponential moving average (as indicated by the red line), but has also traded above it for quite a while.

USDJPY Daily Chart - November 2019

Downward Price Breakout

You can also see from the chart above that it was clearly trending within two trendlines that marked the high and low points of this rising trend, but significantly closed below the lower trendline last week.

To be honest, I was expecting that this would probably mark the end of the recent uptrend, and would be the catalyst for a new downward move for the USD/JPY, but so far there hasn’t been a wave of selling to drive the price lower.

This is probably because some analysts, including Goldman Sachs, have been talking down the prospects of a recession in the US and global economy in 2020, predicting growth rates of 2.3% and 3.4% respectively for the coming year.

Nevertheless, there is still a possibility of a strong bearish candle forming on the daily chart in the next few days, so it could still be worth watching.

Future Price Moves

If the price does trade strongly lower, and closes below its two recent lows of 108.24 and 108.28, then I would be fairly confident that this would signal the start of a new downward price breakout.

As a result of this, the price would close below all of its major moving averages (20, 50, 100 and 200-day EMAs) and there is a lot of downside potential because it could easily drop back into the 104 – 106 range.

The alternative scenario is that the recent short-term strength in the USD/JPY continues, and we continue to see the price trading upwards of 109.

If this were to happen, then we would see the 50 and 100-day EMAs cross over the EMA (200), which is a very bullish signal that could attract a wave of buying to push the price above its previous highs of 109.50 and beyond the 110 level.

So the point is that while the picture is still unclear, the price action of the USD/JPY over the coming days and weeks could give you a strong indication as to whether there is going to be a sustained upwards or downwards trend in the near future.

I would probably favour a downward breakout at this moment in time simply because the MACD and stochastic indicators are suggesting that this long-term upward trend is running out of momentum on the weekly chart, but as I say, there is no need to second-guess the direction of any breakout until we get some clearer signals on the daily chart.

Filed Under: Analysis Tagged With: breakout, usdjpy

EUR/USD Price Action in 2019 Highlights Importance of EMA (200)

November 18, 2019 by James Woolley Leave a Comment

Moving Average Trend Benefits

If you ask a technical trader which indicators they like to use when trading the forex markets, you can be certain that many of them will use moving averages.

That’s because these simple indicators give you an instant snapshot of the current trend in the markets.

It doesn’t matter if you are using the simple, exponential, volume or weighted moving average. If the indicator is moving higher, then the market is in an upward trend, and if it is moving lower, it is obviously in a downward trend.

The 200-Day Moving Average

You can use many different period settings for whichever moving average you like to use to immediately identify the short, medium and long-term trend at any given time, but one of the most useful and most widely used indicators that many longer term traders like to use is the 200-day moving average.

It is largely down to personal preference whether you use the simple or exponential moving average, but they both highlight the long-term trend really well.

I personally use the 200-day exponential moving average, or EMA (200) for short, and have always found it to be really useful when trading currencies and stocks.

It’s often significant when the price breaks through this EMA (200), and is equally significant when many of the shorter-term moving averages cross above or below this indicator because it will often indicate a change of trend.

However it can often act as a strong support or resistance level, particularly after the price has risen or fallen sharply in a short space of time, and in this article I thought I would demonstrate this by showing you the daily price chart of the EUR/USD pair:

EURUSD Daily Price Chart 2019

Strong Resistance in 2019

As you can see from the chart above, the price of the EUR/USD has been slowly trending downwards for much of 2019, but there have always been some mini-rallies along the way.

More importantly, you will see that on most occasions the price has not only struggled to break through this key indicator (shown in red), but has run into strong resistance and been actively driven lower every time it came close to this indicator, except for one occasion when it briefly traded slightly above particular indicator.

Conclusion

Therefore the point that I want to get across in this article is that traders pay close attention to the 200-day exponential moving average, and as a result of this, any resulting price moves almost become self-fulfilling once the price starts to move away from this key level.

On many occasions it will act as strong support or resistance, as was the case here with the EUR/USD, where you could have made some good returns going short each time the price got close to the EMA (200), but it can also signal a change of trend when it is finally broken, in which case you can also potentially make some good returns because you can get in at the start of a new trend.

So it is always worth adding the EMA (200) to your daily price chart if you like to trade this time frame.

Filed Under: Analysis Tagged With: eurusd

eToro Trading Update – October 2019

November 1, 2019 by James Woolley Leave a Comment

Steady Gains – Up 2.21%

October was turning out to be another excellent month for my eToro trading account (account ID = SteadyProfits) as I was up over 4% at one point, but unfortunately some of my share holdings dropped back towards the end of the month after reporting their latest Q3 figures.

As a result of this, my account only finished 2.21% up for the month of October, which is still fairly good, but obviously not as good as it could have been.

SteadyProfits eToro Trading Performance October 2019

The end of October also brought me to a significant milestone because as you can see from the stats page above, I have now been trading on eToro for 12 months.

I actually picked the worst possible time to start trading and investing in stocks because November and December 2018 were terrible months for the world stock markets, but things have picked up in 2019 and after ending 2018 down 8.74%, my account is up 13.71% so far in 2019, giving me a fairly healthy gain overall.

My aim now is to finish 2019 up more than 15% in total, and I am fairly confident of doing so because I think November and December could be a lot more profitable this year.

Trading Performance / Portfolio Update

In terms of trading, October was quite a busy month. I started off by banking a profit of just over 5% when I sold my Barclays shares, and a few days later I sold my GVC shares that I bought at just under 750p for 820.8p, for a profit of 9.61%.

In addition, I also sold some of my longer-term holds that have finally moved into profit after trading significantly lower in previous months, including Aviva and a portion of my IAG shares.

Finally, I managed to generate an excellent short-term gain by trading GlaxoSmithKline. Having bought at 1631p and 1652.4p a few weeks ago, I closed out both trades when the price moved to 1702.4p just over a week later.

With regards to new trades, I have mainly been buying some of the large-cap giants of the FTSE 100, such as BP, Shell and HSBC, because these have all been pushed down to bargain prices in recent weeks, largely because of weaker Q3 performance, but they all pay a dividend of more than 6% per year and are unlikely to drop much further.

I have also started scaling into the iShares FTSE 100 tracker (ISF), making my first purchase when the FTSE 100 dropped to around 7250, and will add more if it drops back towards the 7000 level.

The only share that continues to disappoint and act as a drag on my portfolio is Imperial Brands, but I’m not going to sell at such a crazy low price, and will simply bank the 10%+ dividend while I wait for it to recover.

Dividends Received

There were no dividend payments this month, but the trading profits more than compensated for this, and the good news is that there are some significant dividends due in November.

BP, Shell, Imperial Brands and IAG are all going ex-dividend this month, and as you may be aware, eToro pay their dividends on these ex-dividend dates instead of the official payment date.

Copiers

In the month of October I had one more person choose to copy all of my trades, which means that I now have a grand total of two copiers on eToro.

This has added an extra level of responsibility, but is one that I am relishing because it is a great feeling to know that my trading is potentially helping other people make money from the markets.

Final Thoughts

Overall it ended up being a slightly disappointing month with my profits tailing off in the last few days of the month, but I’m still fairly happy with my trading performance overall.

I managed to close out some very profitable trades on GVC and GlaxoSmithKline, and bought some excellent stocks at knock-down prices in the form of BP, Shell and HSBC.

Plus to cap it all off, I gained one more copier, and have some juicy dividends to look forward to in November, as well as a potential Christmas rally towards the end of the year, which we didn’t really benefit from last year. So 2019 could turn out to be a very profitable year.

Follow Me on eToro

If you would like to follow my journey on eToro, simply open an eToro account and search for SteadyProfits to view my live trading results and to see my latest trades.

Past performance is not an indication of future results. This content is for information and educational purposes only and should not be considered investment or portfolio management advice. 81% of retail investors accounts lose money when trading CFDs with this provider.

Filed Under: News Tagged With: etoro, steadyprofits

Forex Rebates:

Choose from 40+ different forex brokers and crypto exchanges, and get cashback every time you trade:


Copy Profitable Traders:

If you join ZuluTrade, you can follow and subscribe to profitable traders and all of their trades will be automatically copied in your own trading account.

You can also earn money as a signal provider if you are already a profitable trader.

Click here to find out more

Recommended Broker:

Recent Blog Posts:

  • High Probability Trade on S&P 500 – 26 January 2024
  • Oanda Moves Into Prop Trading With Labs Trader Program
  • My eToro Performance in 2023 – Up 33.24%
  • The5ers Offering $20K Bootcamp Challenge For Just $1
  • Example of VWAP Bounce Trade on S&P 500 – 18 December 2023

Recent Articles:

VWAP Indicator
  • MA Sabres (LuxAlgo) Indicator
  • 10 Harsh Truths About Forex Trading
  • Best Websites for Monitoring Currency Strengths
  • Xmaster Formula Indicator for MT4 and MT5
  • Tools:

    Currency Heat Map

    Categories

    • Analysis
    • News

    Archives

    • January 2024
    • December 2023
    • November 2023
    • October 2023
    • September 2023
    • August 2023
    • July 2023
    • June 2023
    • May 2023
    • August 2020
    • June 2020
    • May 2020
    • April 2020
    • January 2020
    • December 2019
    • November 2019
    • October 2019
    • September 2019
    • August 2019
    • July 2019
    • June 2019
    • May 2019
    • April 2019
    • March 2019
    • February 2019
    • January 2019
    • December 2018
    • November 2018
    • October 2018
    • September 2018
    • August 2018
    • July 2018
    • June 2018
    • May 2018
    • March 2016
    • December 2015
    • November 2015
    • October 2015
    • August 2015
    • July 2015

    Disclaimer

    This website should be used for general information purposes only and in no way represents professional financial advice.

    Forex and CFD trading carries a high level of risk and it is possible to lose more than your initial deposit if using leveraged products.

    Copyright © 2025 · eleven40 Pro Theme on Genesis Framework · WordPress · Log in

    • About
    • Contact
    • Disclosure
    • Privacy Policy
    • Terms Of Service