The Forex Chronicles

  • Rebates
  • Brokers
  • News
  • Analysis
  • Signals
    • Best Copy / Social Trading Platforms
    • eToro Review
    • FXTM Invest Review
    • Marketclub Review
    • ZuluTrade Review
  • Indicators
  • Strategies
  • Articles

Archives for May 2023

Account-Destroying Trading Range in the S&P500 – 23 May 2023

May 23, 2023 by James Woolley Leave a Comment

Introduction

As a day trader, you always want to see strong trends upwards or downwards with plenty of volatility because this will enable you to either ride these trends upwards or downwards, or trade the reversals when these trends run out of momentum.

The one thing you don’t want to see is a very narrow trading range with little or no volatility because this can make it very difficult to find winning trades, and can actually destroy accounts.

However this is exactly what we saw in the first 3 hours of the trading session when the S&P500 market opened earlier today, as you can see below:
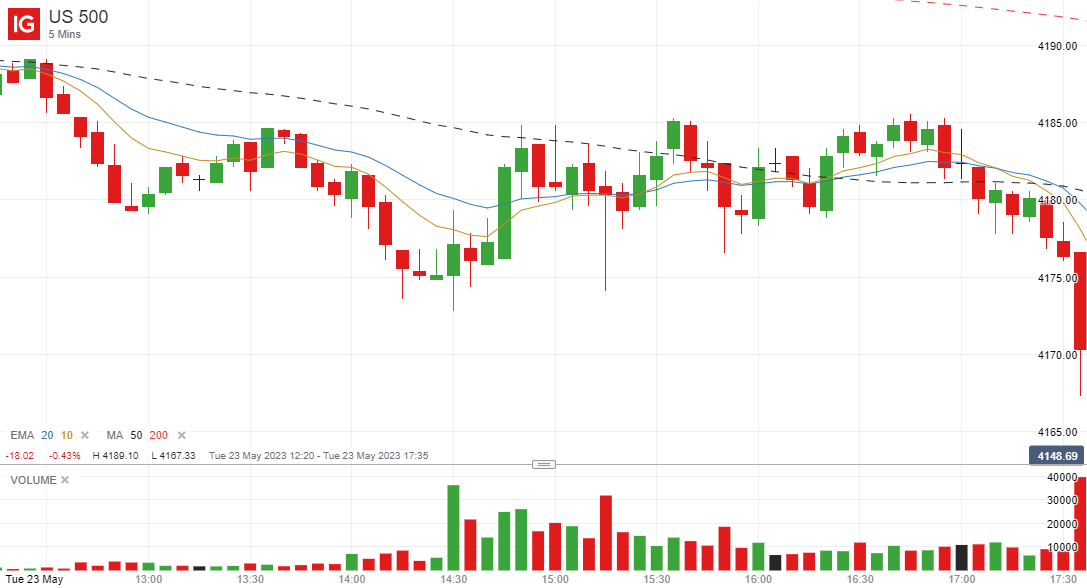
Trading Range

The price did fall later in the day, but during this opening 3-hour session, when most day traders like to trade, the price of the S&P500 was just drifting in a sideways trading range between about 4178 and 4185, which is just a 7 point range.

There were a few occasions when the price moved out of this range, but it quickly moved back to this trading range each time.

Why Narrow Ranges Are So Hard to Trade

There are some day traders who like to trade tight trading ranges like this, and will just continue to sell short at the top of the range and go long at the bottom of the range, capturing small profits each time, but the vast majority of day traders don’t trade like this.

Most day traders will tend to trade breakouts out of this range in the hope of capturing the start of a new trend, and when you get a sideways market like this, it can potentially destroy accounts as traders keep getting stopped out on every possible breakout.

The problem is that you don’t really know that the market is going to trade like this before the market opens. In fact the S&P500 (future) actually moved more than this when the US market was closed, trading as high as 4210 in the overnight Asian session.

So you would think that having fallen so much out of hours, the price would move a lot more when it actually happened, but this wasn’t the case today.

Closing Comments

The point I want to get across is that very tight trading ranges are generally very bad news for the vast majority of day traders because they can really chop you up and result in lots of small losses.

There is no way of knowing whether you are likely to experience a day like today ahead of time, although the market will sometimes give you clues.

For example, if you get two or three days where the trading range has been well above the ATR (average true range) on the daily time frame, then there is a higher chance that you will see a smaller consolidation day with a tight range at some point.

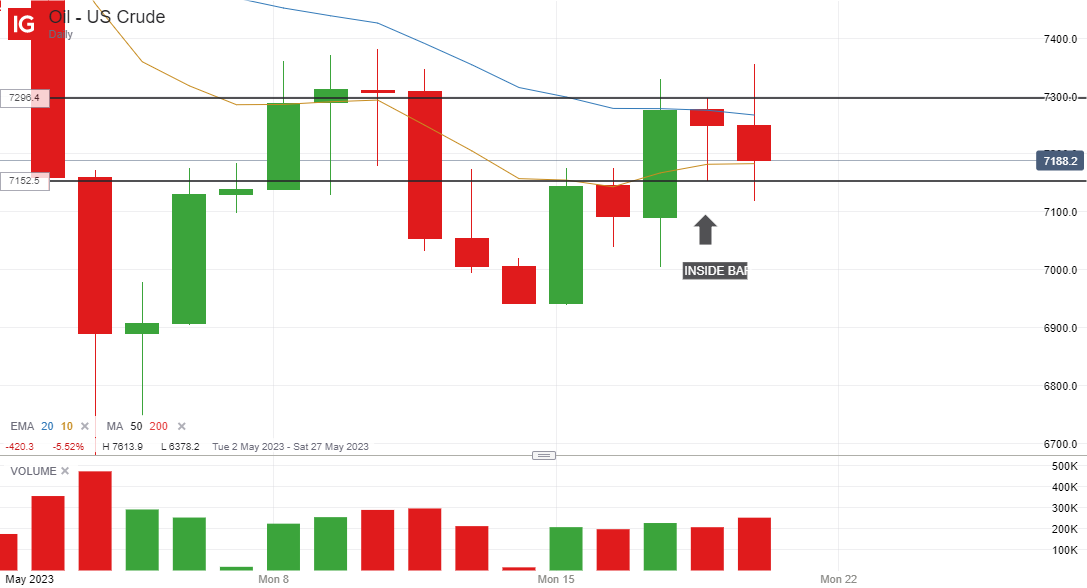
Similarly, if you have a large daily candle up and an equally large daily candle down with the price closing somewhere near the middle, you are quite likely to see an inside bar day in the third day.

Finally, if the price has been trading in a narrow range on the higher time frames, which the S&P has been doing, then this increases the chances of a tight range as well.

Therefore if you are struggling to make money from day trading the S&P right now, you certainly aren’t alone.

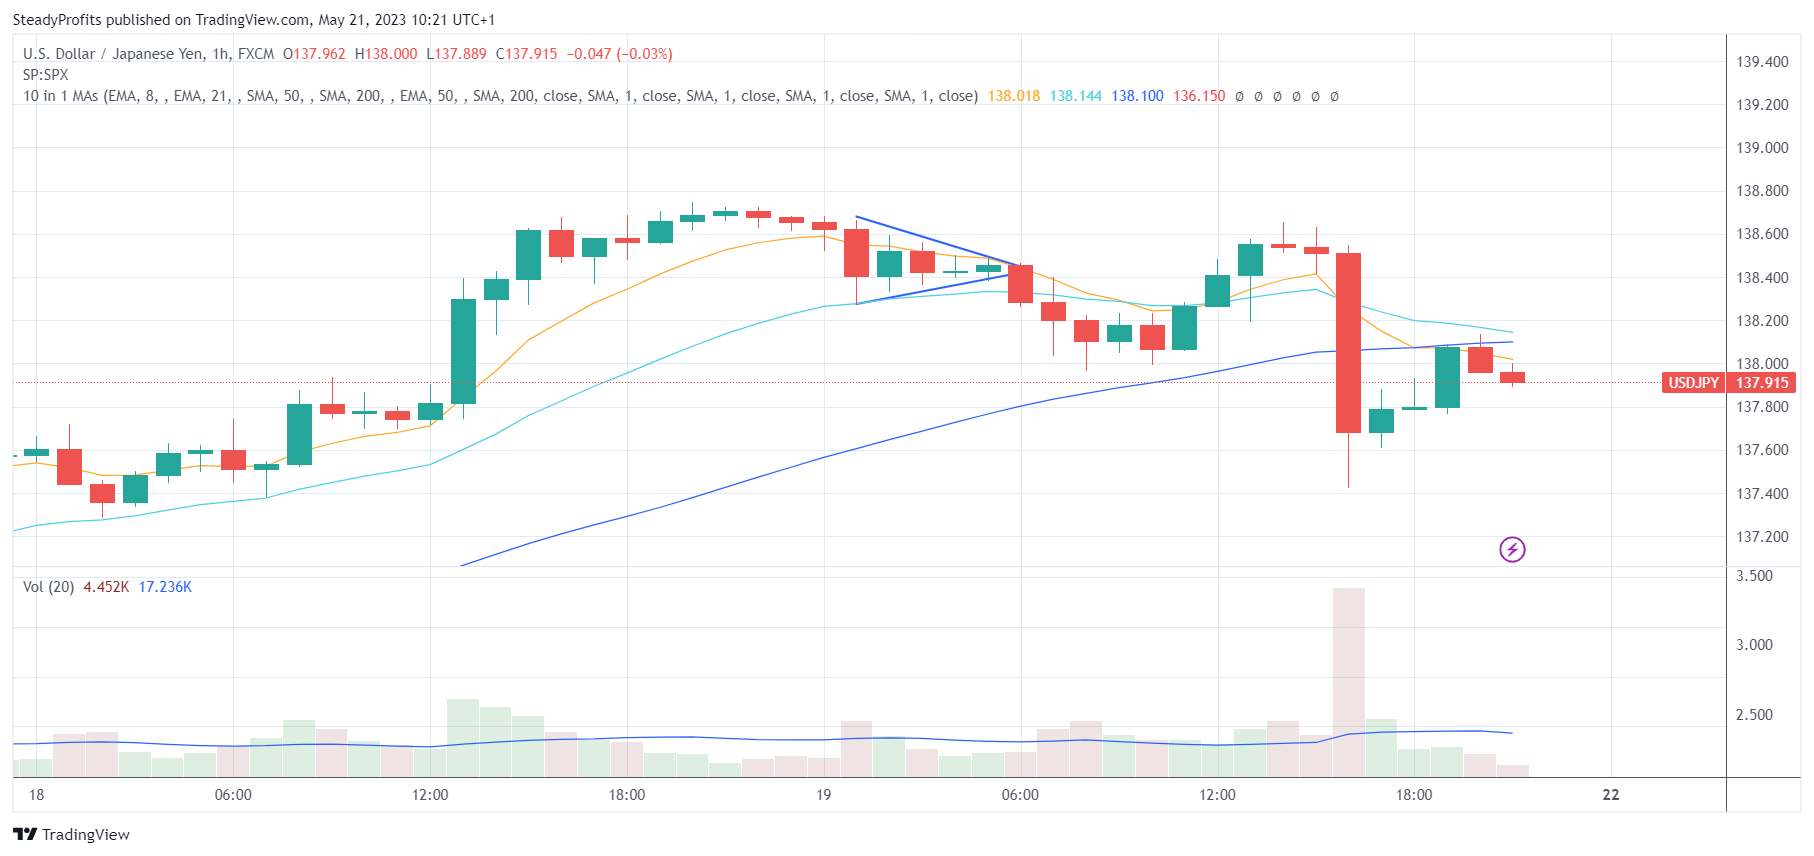
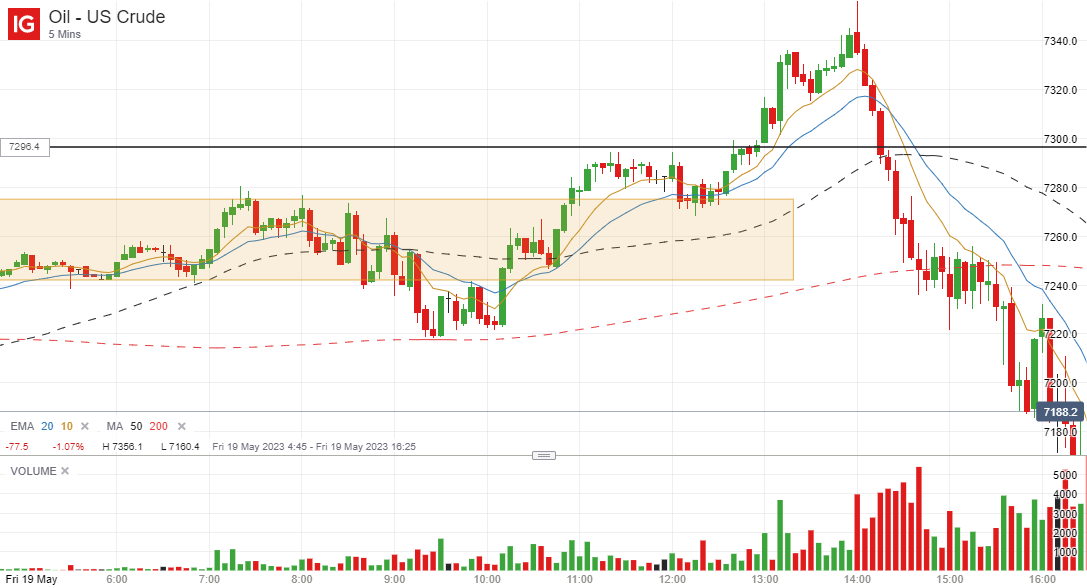
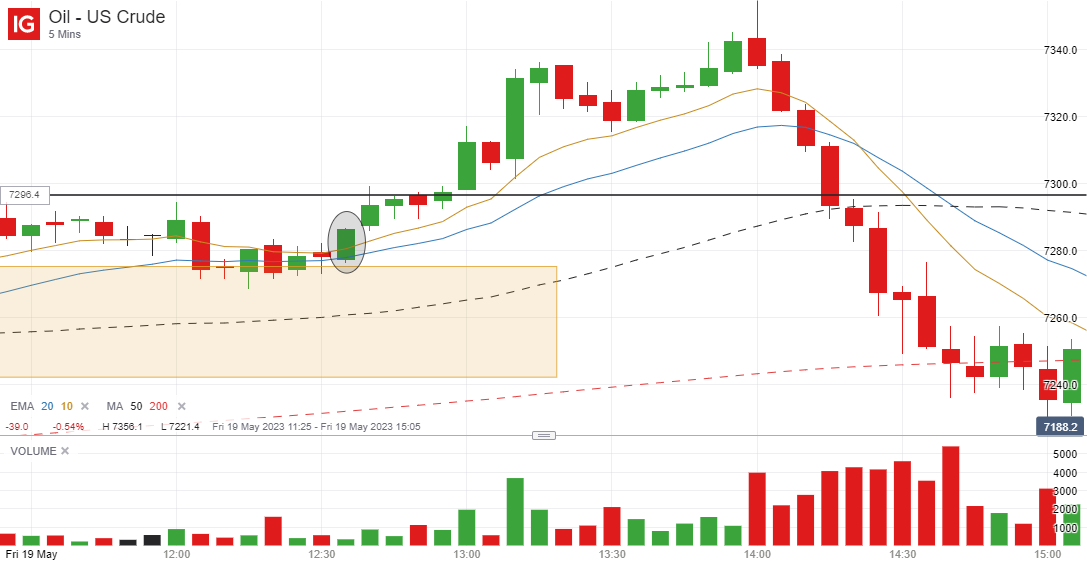
The S&P500 can be a great market to trade, but it might be a good idea to trade more volatile markets such as oil or the major forex pairs when this index continues to trade in a narrow range on the daily chart.

Filed Under: Analysis Tagged With: s&p500, spx

5 Hourly Inside Bar Candles on the USD/JPY – 19 May 2023

May 21, 2023 by James Woolley Leave a Comment

Introduction

I have always been a big fan of inside bar set-ups because these provide you with a low-risk, high probability entry point that can potentially have high rewards.

You can either trade them on the shorter time frames, such as the 5 or 10-minute charts, for example, to scalp a few points, or you can use them on the 1 hour, 4 hour or daily time frame to target even bigger moves.

The reason why they work so well is because you get a wide trading range with the initial candle followed by a series of smaller indecisive candles that all trade within the range of this first bar.

So when the price does eventually break above the high or below the low of the first bar/candle, the move can be quick and decisive as it will often quickly gather momentum and continue moving in the direction of the breakout.

USD/JPY Set-Up

I wasn’t at my computer during the Asian and pre-London trading session on Friday (19 May 2023), but as I was reviewing my charts this weekend, I noticed what would have been a really great set-up on the 1 hour chart of the USD/JPY pair.

There was a large red candle at 1.00 AM UK time right at the start of the Asian trading session on the USD/JPY pair, followed by four very small candles that all traded within the range of this initial candle between 2 AM and 6 AM, as you can see below:

Trading Opportunity

With a narrow triangle forming on this inside bar set-up, it was only a matter of time before the price broke upwards or downwards out of this tight range, and when it did occur the hourly breakout candle closed at 7 AM, just when volume starts to pick up before the London market opens.

Therefore it was always likely to continue moving, and in this case if you had taken a short position at the close of the breakout candle at 138.28, you could have ridden it down to the 138.00 whole number or closed a partial for 28 pips profit, where it ended up finding support.

You could also have zoomed into the 1 or 5-minute chart to get an earlier entry point during the 1-hour breakout candle once it looked likely that this breakout was likely to continue.

Final Thoughts

Of course it’s easy to talk about these profitable set-ups after they have occurred, but the point is that these inside bar formations occur all the time, and when you a get a long extended set-up of 5 hourly candles in this case, the odds of success are extremely high when the breakout does eventually happen.

Therefore you always want to be scanning the charts of various pairs (on various time frames) to try to visually spot them when they are setting up because they can be very profitable to trade.

Filed Under: Analysis Tagged With: breakout, inside bar, usdjpy

Crude Oil Intraday Set-Up – 19 May 2023

May 20, 2023 by James Woolley Leave a Comment

Introduction

Many forex traders will tend to focus all of their attention on the major forex pairs, such as the GBP/USD, EUR/USD and USD/JPY pairs, for example, but the oil markets can be just as profitable, if not more so, when day trading.

That’s because you can often get 200-300 point swings in a day, and there is generally lots of volatility during the London and New York trading sessions, which makes it easy to find one or two high quality set-ups.

One such set-up presented itself yesterday on US crude oil yesterday (19 May 2023), as I will now discuss in more detail.

Previous Price Action

Going in to Friday, I knew that Thursday had been an inside bar on the daily chart of US crude. Therefore I was expecting Friday to potentially be a more volatile day with a wider trading range.

My bias was towards the downside because I was looking for the price to break below the Thursday low of this inside bar, and make a sustained move downwards to erase some of the upward momentum of Monday and Wednesday.

Early Morning Price Action

The low of the inside bar was $71.54, so this was the key level that I was looking at, but as you can see from the shaded rectangle that I drew on the chart, the price was trading in a narrow range during this time and was nowhere near this key level. Therefore a breakout was looking unlikely at this stage.

The price did break out of this channel at around 9.15 AM (London time) but was still around 70 points short of this key level even at the low. So it wasn’t really worth trading the breakout at this time.

Failed Breakout

This attempted breakout ultimately failed, and the price came back into the early morning trading range, before breaking upwards outside the high of this range.

When this happens, you have to accept that your bias towards the downside may be wrong, and it may be worth considering trading an upward breakout of the inside bar instead (which stood at $72.96).

Weekly Resistance and Inside Bar Breakout

Looking at the daily chart, I was aware that there was very strong resistance around the $73 level from Wednesday and Thursday, and indeed from previous days earlier in the month, and this was reflected in the price action because the upward momentum started to stall as it got towards this level.

I knew that we could get an attempted breakout into higher ground if we could stay within 20 or 30 points of this key level, and so when the large red candle on the 5 minute chart failed to result in a pullback, and instead started to trade in a very narrow range, it was time to sit up and take notice.

Taking the Trade

I have talked about 5-minute momentum trades on this site before, and how they can be very profitable in the right trading conditions, and this looked like being one of them.

The 10 and 20-period EMAs were now very close to each other on the 5-minute chart and this new trading range was sitting right on the high of the previous trading range.

It was just a case of watching the price action and waiting for a strong green bullish candle breaking upwards outside of this very narrow range.

Here is a zoomed in view of what happened…

After two inside bars followed by a green breakout candle, I took a long position on the close of this candle at 72.87 with a stop under the previous candle low of 72.73.

My stop was therefore 14 points, and I was hoping for a profit of at least 2 times my risk, ie 28 points.

In the end I closed out my entire position at 73.25 for a profit of 38 points and a risk/reward trade of around 2.7 after I had moved my stop loss up to this level and was stopped out, which I was more than happy with.

I was hoping that the upward momentum would continue for a much bigger move, but even after I was stopped out, the price only reached a high of 73.56 and the breakout quickly fizzled out and reversed sharply later in the day as longer term traders banked their profits from previous longs earlier in the week.

Final Thoughts

The point of this article was not to brag about having a profitable trade on US crude oil yesterday (I have just as many losing trades as winning trades, just like most traders), but merely to walk you through my thought process regarding this potential set-up, and to demomnstrate the profit potential of these momentum trades from tight trading ranges on the 5-minute chart.

These high probability set-ups don’t come around that often each day, but you need to keep an eye out for them because they can be fairly profitable when they do come along, and because the price is breaking out of a narrow range, you can keep your stop losses small and go for bigger wins of 2 or 3 times your risk, which are the trades that we all want to find.

Filed Under: Analysis Tagged With: breakout, inside bar, oil

Forex Rebates:

Choose from 40+ different forex brokers and crypto exchanges, and get cashback every time you trade:


Copy Profitable Traders:

If you join ZuluTrade, you can follow and subscribe to profitable traders and all of their trades will be automatically copied in your own trading account.

You can also earn money as a signal provider if you are already a profitable trader.

Click here to find out more

Recommended Broker:

Recent Blog Posts:

  • High Probability Trade on S&P 500 – 26 January 2024
  • Oanda Moves Into Prop Trading With Labs Trader Program
  • My eToro Performance in 2023 – Up 33.24%
  • The5ers Offering $20K Bootcamp Challenge For Just $1
  • Example of VWAP Bounce Trade on S&P 500 – 18 December 2023

Recent Articles:

VWAP Indicator
  • MA Sabres (LuxAlgo) Indicator
  • 10 Harsh Truths About Forex Trading
  • Best Websites for Monitoring Currency Strengths
  • Xmaster Formula Indicator for MT4 and MT5
  • Tools:

    Currency Heat Map

    Categories

    • Analysis
    • News

    Archives

    • January 2024
    • December 2023
    • November 2023
    • October 2023
    • September 2023
    • August 2023
    • July 2023
    • June 2023
    • May 2023
    • August 2020
    • June 2020
    • May 2020
    • April 2020
    • January 2020
    • December 2019
    • November 2019
    • October 2019
    • September 2019
    • August 2019
    • July 2019
    • June 2019
    • May 2019
    • April 2019
    • March 2019
    • February 2019
    • January 2019
    • December 2018
    • November 2018
    • October 2018
    • September 2018
    • August 2018
    • July 2018
    • June 2018
    • May 2018
    • March 2016
    • December 2015
    • November 2015
    • October 2015
    • August 2015
    • July 2015

    Disclaimer

    This website should be used for general information purposes only and in no way represents professional financial advice.

    Forex and CFD trading carries a high level of risk and it is possible to lose more than your initial deposit if using leveraged products.

    Copyright © 2025 · eleven40 Pro Theme on Genesis Framework · WordPress · Log in

    • About
    • Contact
    • Disclosure
    • Privacy Policy
    • Terms Of Service