The Forex Chronicles

  • Rebates
  • Brokers
  • News
  • Analysis
  • Signals
    • Best Copy / Social Trading Platforms
    • eToro Review
    • FXTM Invest Review
    • Marketclub Review
    • ZuluTrade Review
  • Indicators
  • Strategies
  • Articles

Archives for June 2023

Opening Range Breakout on US Crude Oil – 14 June 2023

June 14, 2023 by James Woolley Leave a Comment

Introduction

Opening range breakouts can be some of the easiest and most profitable trades to execute when you get some good set-ups, and today we had a textbook set-up on the US crude oil market.

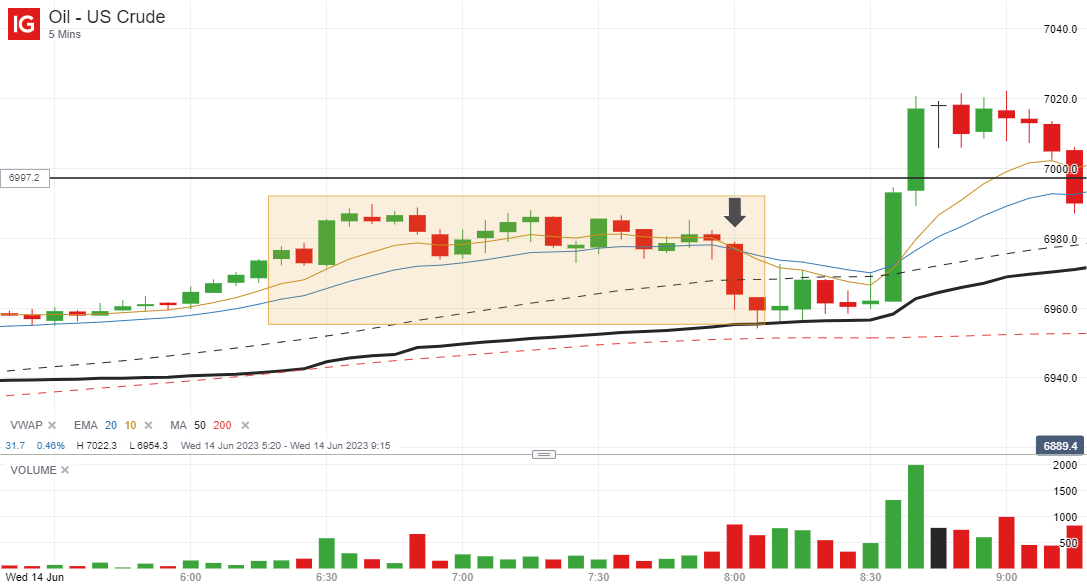
I like to wake up and start scanning my charts around 7 AM UK time, and as we got closer to 8 AM, it was apparent that US crude had been trading in a very tight sideways range since around 6.15 and was poised to break out of this range, either upwards or downwards, once the London market opened.

With the price hovering just above the 10 and 20-period EMAs on the 5-minute chart, and bearing in mind that we were sitting right on yesterday’s high, I wanted to see a downwards break, and that’s exactly what happened:

Trade Execution

With this type of set-up, it is best to either enter a trade on the 1-minute chart or enter a position based on pure price action.

That’s because if you wait for the 5-minute breakout candle to close, you will often find that a large part of the move will have taken place already, and subsequently you will be entering too late.

I myself did the latter and entered a short position straight after the London market opened when I saw the price starting to tick down fast, getting in at 6973.7, ie $69.737.

I placed my stop loss at the high of the previous 5-minute candle at 6982.3, 8.6 points away, and I was initially planning to exit half the position at VWAP, approximately 18 points away and indicated by the thick black line on the chart, and then let the other half run in case the price blasted straight through it.

As you can see, the VWAP ended up acting as support as it so often does, and after closing half the position at VWAP, the price came right back up and nearly took me out at break-even.

However thankfully the price came back down and I eventually decided to close the other half out at VWAP once again when I had the chance because it wasn’t acting right.

So the total profit from this trade was around 18 points, representing a reward to risk of over 2 to 1, which I am always more than happy with.

After all, if you can find risk-reward trades of 1-2 (trades that return 2 points of profit for 1 point of risk), if they only work out 40% of the time, for example, you will still earn some decent profits in the long run.

Closing Comments

The main point I wanted to get across is that the opening few hours of the London trading session can be very profitable if you like to trade opening range breakouts.

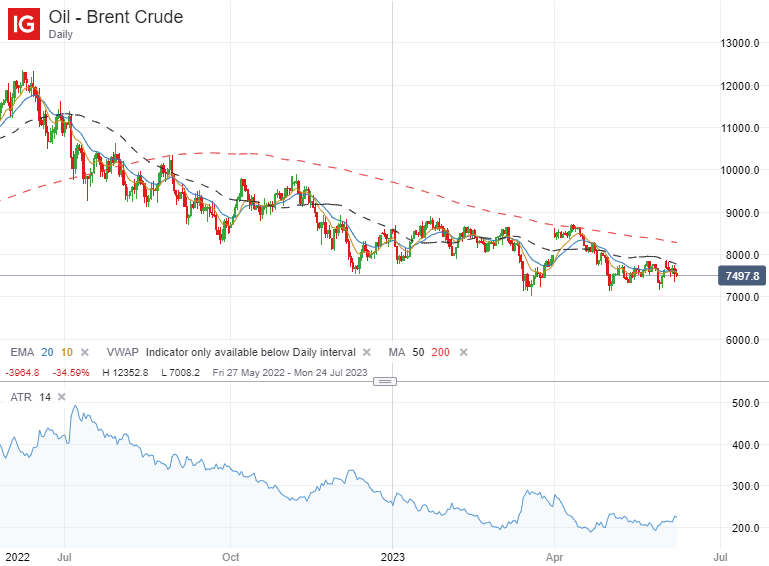
The key is to find markets that have traded in a very narrow range leading up to the open because in the case of US crude, for example, we know from my last post that it trades in a range of around 236 points on average at the moment.

Therefore when it traded in a 30-point box from 6.15 to 8.00 AM UK time, something had to give. It was inevitable that we would see a breakout. All I had to do was be patient and jump on board when it eventually happened.

Of course there will be false breakouts from time to time, but when this occurs, the secondary breakout will often be the one that cancels out the initial loss and brings in the big money.

So always try to look out for sideways consolidations in otherwise volatile markets because the price is very unlikely to stay in this tight range for very long.

Filed Under: Analysis Tagged With: breakout, oil, opening range breakout, us crude

Average Daily Trading Range of the Major Forex Pairs in 2023

June 11, 2023 by James Woolley Leave a Comment

Introduction

If you are day trading the forex markets, or like to trade commodities, cryptocurrencies or stock market indexes, for example, it is always useful to know which markets are showing high levels of volatility and trading in a wide range on a daily basis.

That’s because a market that is moving in a range of 200 pips per day will be a lot easier to capture decent sized profits from than a market that is only moving around 20 pips per day on average, for instance, particularly when you factor in spreads and commissions.

So with that in mind, let’s take a look at the latest average true range (ATR) readings of all of the major currency pairs, indices, commodities, metals and cryptos as of right now (11 June 2023) as we head into the quieter summer period.

This will tell you which markets are potentially worth day trading, and which ones are probably best avoided.

Major Currency Pairs

  • AUD/NZD – 57
  • AUD/USD – 58
  • EUR/CHF – 40
  • EUR/GBP – 37
  • EUR/JPY – 94
  • EUR/USD – 51
  • GBP/EUR – 49
  • GBP/JPY – 118
  • GBP/USD – 81
  • USD/CAD – 65
  • USD/CHF – 61
  • USD/JPY – 90

There is no doubt that the average true range of these forex pairs has fallen since I last compiled this data back in 2020, but that’s to be expected because that was a very volatile period as COVID was just starting to take hold all over the world.

The reality is that there are plenty of currency pairs that still offer a good deal of price movement every day, and are therefore potential trade candidates.

I myself like to mainly trade the GBP/JPY and GBP/USD pairs because they have a wide daily trading range, 118 and 81 pips respectively, as shown here, and I’m also predominantly based in the UK, which means I can trade the busy London and New York sessions.

I also used to like to trade the EUR/USD pair but this seems to move less than before, just 51 pips, and I find that the GBP pairs give me more than enough opportunities every week.

For those traders based in Asia, the major Yen pairs all provide lots of liquidity and volatility, and benefit from tight spreads, while traders based in Australia or New Zealand may also prefer to trade these pairs because of the favorable time zone and the fact that these are more volatile than the Australian and New Zealand dollar pairs.

USA-based traders are lucky because many of the USD pairs offer big price swings every day, especially the GBP/USD and USD/JPY pairs, but many of the currency pairs are very active during the US session, so most of the major pairs can potentially be traded profitably at this time.

Stock Market Indices

  • FTSE 100 – 58
  • DAX – 123
  • DOW JONES – 269
  • S&P 500 – 40
  • NASDAQ 100 – 195

With the S&P 500 hanging out in the 4050-4150 range for several weeks and seeming reluctant to fall back down, the volatility of this index fell sharply, and now has a daily average price movement of just 40 points.

This has made it noticeably harder for many day traders to trade because there have been a lot of sideways price movements in recent months, which will often chop you up.

The other indices have also experienced narrower trading ranges, with the Nasdaq 100 almost half as volatile (195 points) as it was this time last year, for example.

That’s to be expected when we experience rising stock markets, but it’s not necessarily beneficial to day traders, who can often generate more profits when the markets are falling, or at least fluctuating up and down a lot more.

Commodities

  • BRENT CRUDE – 225
  • US CRUDE – 236
  • GOLD- 23
  • SILVER – 48

Gold, and to a lesser extent silver, often present day traders with plenty of volatity, and that’s still the case now. With a daily range of $23, gold still continues to trade in quite a wide range on a daily basis.

As you can see below, the oil markets have calmed down a lot since a year ago, when they were moving an average of 500 points per day, but I find that they still offer lots of good trading opportunities with a trading range in excess of 200 points per day.

Brent Crude Average True Range 2023 Chart

Cryptocurrencies

  • BITCOIN – 861
  • ETHEREUM – 58

There was a time when day trading cryptos was practically impossible because of the prohibative spreads, but with a daily trading range of 861 points on Bitcoin, for example, and much tighter spreads, it is now possible to generate profits from these daily price movements.

I don’t attempt to do so myself, but I know a few people who find that their usual day trading strategies work just as well, if not better on these instruments.

Final Thoughts

It is often said that scalpers should look to capture around 10% of the daily average true range (ATR) per trade, while proficient swing traders should look to capture up to 40% of the average range.

So despite the fact that we are entering one of the quietest periods of the year when many people will be taking vacations and enjoying the summer, there is still plenty of volatility in the markets to keep day traders satisfied.

I like to focus my attention on the GBP/JPY and GBP/USD pairs, as well as gold and US crude oil, but with average trading ranges of 195 and 269 points on the Nasdaq and DJ30 respectively, it’s easy to see why some traders focus on the indices instead.

Ultimately it comes down to your own personal trading strategy and what works for you, but finding the markets with the highest volatility will often help you in your quest to generate consistent returns.

Filed Under: Analysis Tagged With: atr, average true range, daily trading range, volatility

Forex Rebates:

Choose from 40+ different forex brokers and crypto exchanges, and get cashback every time you trade:


Copy Profitable Traders:

If you join ZuluTrade, you can follow and subscribe to profitable traders and all of their trades will be automatically copied in your own trading account.

You can also earn money as a signal provider if you are already a profitable trader.

Click here to find out more

Recommended Broker:

Recent Blog Posts:

  • High Probability Trade on S&P 500 – 26 January 2024
  • Oanda Moves Into Prop Trading With Labs Trader Program
  • My eToro Performance in 2023 – Up 33.24%
  • The5ers Offering $20K Bootcamp Challenge For Just $1
  • Example of VWAP Bounce Trade on S&P 500 – 18 December 2023

Recent Articles:

VWAP Indicator
  • MA Sabres (LuxAlgo) Indicator
  • 10 Harsh Truths About Forex Trading
  • Best Websites for Monitoring Currency Strengths
  • Xmaster Formula Indicator for MT4 and MT5
  • Tools:

    Currency Heat Map

    Categories

    • Analysis
    • News

    Archives

    • January 2024
    • December 2023
    • November 2023
    • October 2023
    • September 2023
    • August 2023
    • July 2023
    • June 2023
    • May 2023
    • August 2020
    • June 2020
    • May 2020
    • April 2020
    • January 2020
    • December 2019
    • November 2019
    • October 2019
    • September 2019
    • August 2019
    • July 2019
    • June 2019
    • May 2019
    • April 2019
    • March 2019
    • February 2019
    • January 2019
    • December 2018
    • November 2018
    • October 2018
    • September 2018
    • August 2018
    • July 2018
    • June 2018
    • May 2018
    • March 2016
    • December 2015
    • November 2015
    • October 2015
    • August 2015
    • July 2015

    Disclaimer

    This website should be used for general information purposes only and in no way represents professional financial advice.

    Forex and CFD trading carries a high level of risk and it is possible to lose more than your initial deposit if using leveraged products.

    Copyright © 2025 · eleven40 Pro Theme on Genesis Framework · WordPress · Log in

    • About
    • Contact
    • Disclosure
    • Privacy Policy
    • Terms Of Service