The Forex Chronicles

  • Rebates
  • Brokers
  • News
  • Analysis
  • Signals
    • Best Copy / Social Trading Platforms
    • eToro Review
    • FXTM Invest Review
    • Marketclub Review
    • ZuluTrade Review
  • Indicators
  • Strategies
  • Articles

Archives for October 2023

Beware of Spikes in GBP/JPY, EUR/JPY, USD/JPY, AUD/JPY Pairs

October 26, 2023 by James Woolley Leave a Comment

Crazy Spikes in Yen Pairs

If you trade the forex markets every day and follow some of the major yen pairs in particular, such as the GBP/JPY, EUR/JPY, USD/JPY and AUD/JPY, for example, you may have noticed that these have all had some huge spikes at various times in the last few weeks.

Of course it’s normal to see some big price spikes after major economic data releases, but with these yen pairs we have seen some huge movements on all of these pairs at the same time for no apparent reason.

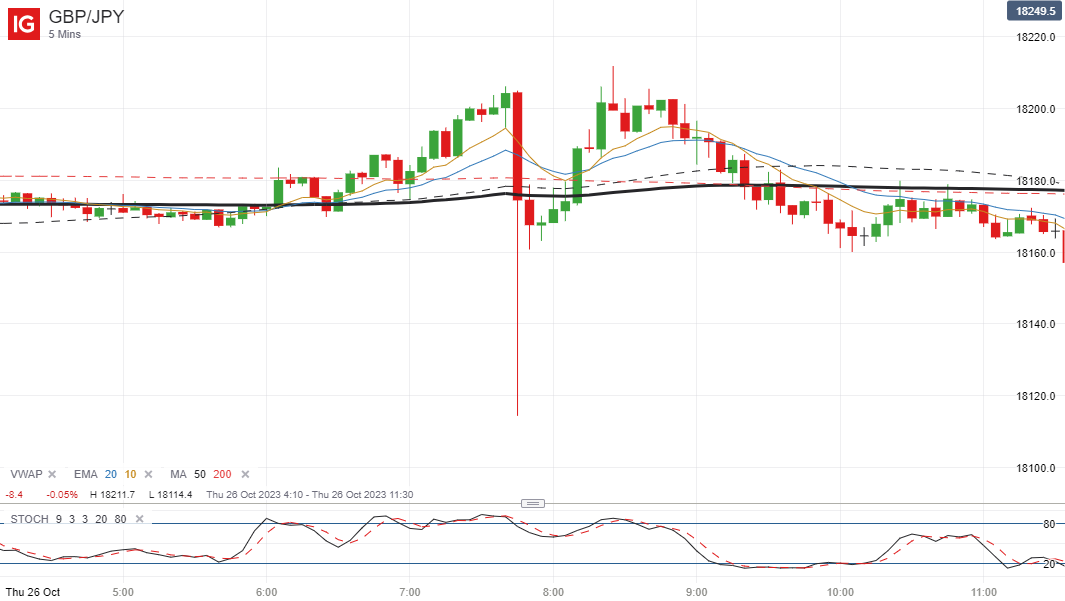
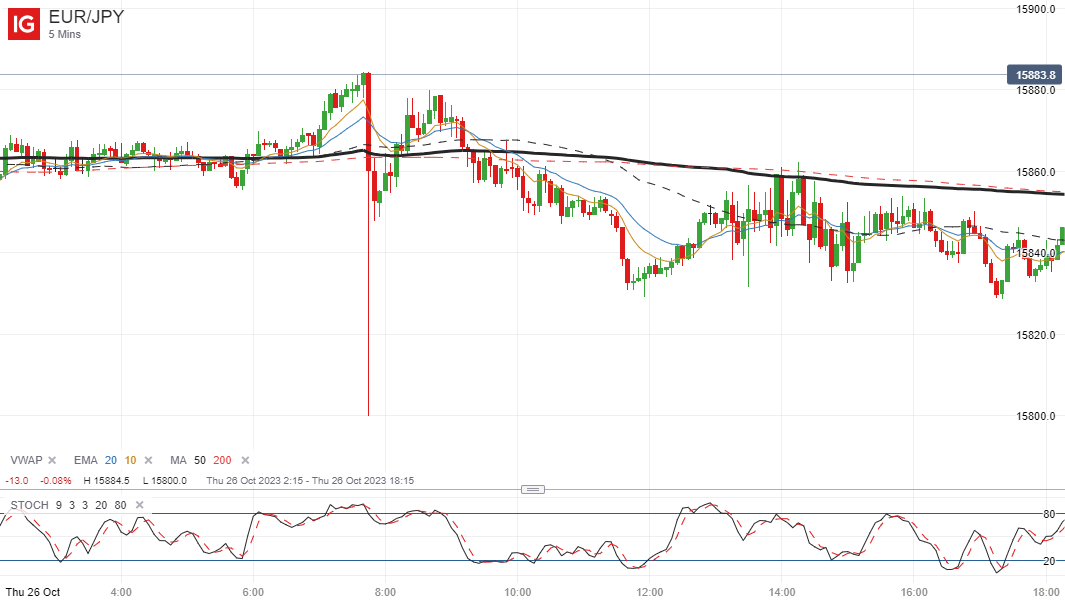
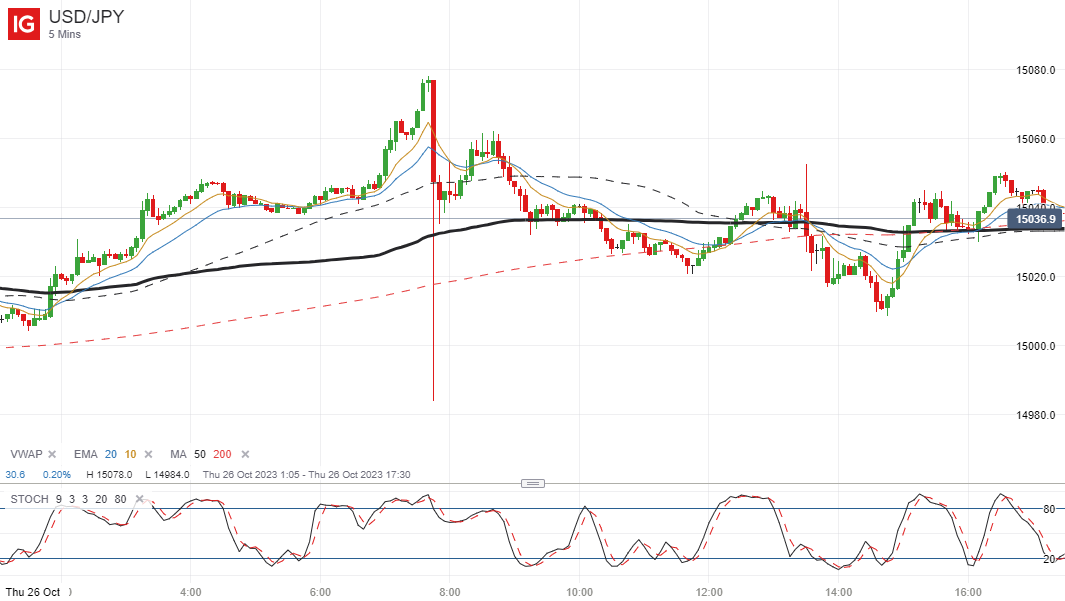
The latest big price spike occurred early this morning at approximately 7.45 AM UK time, when there was no news scheduled on the economic calendar.

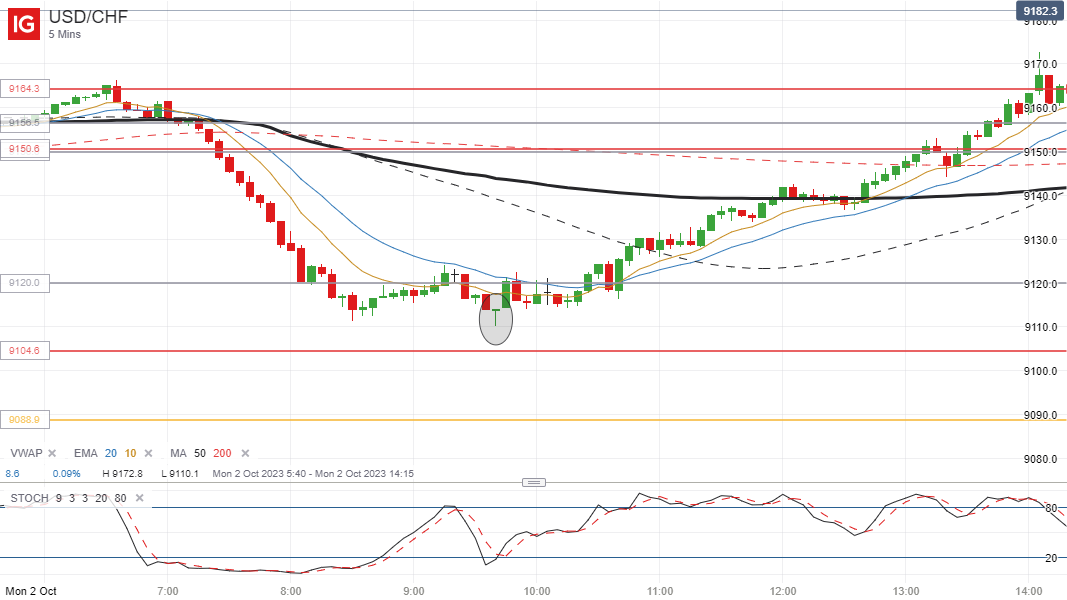
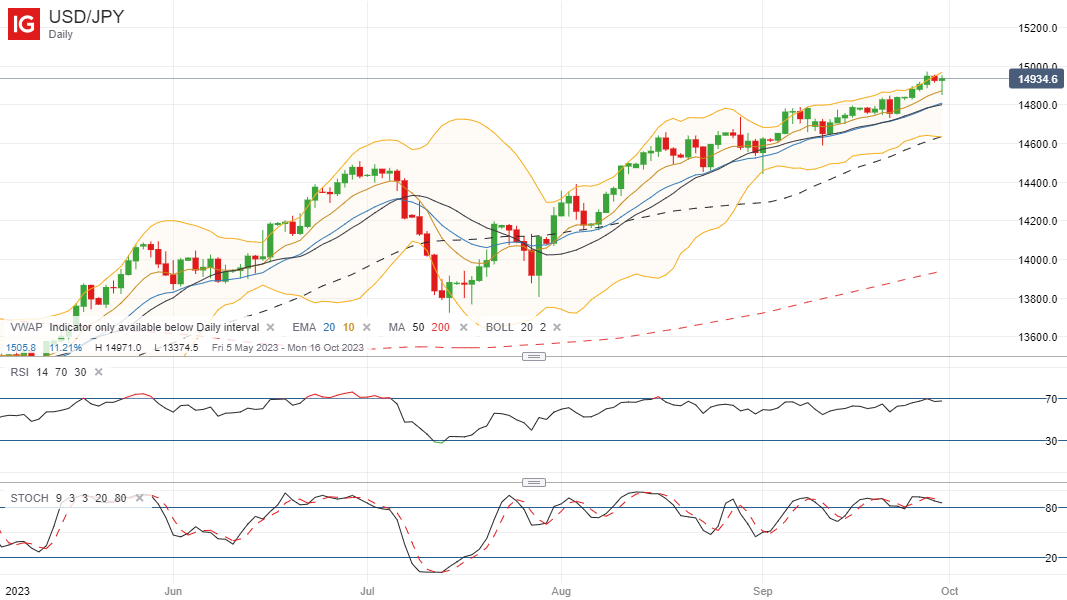
You can see on the 5-minute charts of the GBP/JPY, EUR/JPY and USD/JPY below how the price spiked sharply downwards before bouncing back upwards again almost immediately:

What is Causing These Price Spikes on the Yen?

The most likely explanation is that the Bank of Japan are intervening to try to strengthen the yen, particularly with the USD/JPY continuing to try to push above the key 1.50 level, although nobody knows for sure if this is true or not.

If it is, it doesn’t seem to be working because whenever there is a huge spike down, the price always bounces back straight away.

Why is This A Big Problem for Traders?

These spikes may not necessarily pose a risk for longer term traders who trade the daily, weekly or monthly timeframes, for example, but for those short-term traders who trade the lower timeframes, they can potentially destroy your account.

That’s because even if you use a relatively tight stop loss of 20 points, the price could easily gap down 80-100 points and your stop loss would be executed at this level instead.

Therefore you could incur huge losses on your personal account, and potentially lose a prop firm account if they have a low drawdown limit.

Indeed in recent weeks there have been quite a few traders on X (formerly Twitter) who have said that they lost their prop account because of one of these seemingly random spikes.

What is the Solution to this Problem?

If you want to protect your accounts, I think the most obvious solution is to simply stop trading the yen pairs altogether until the markets settle down and these sharp spikes stop happening.

There are plenty of other pairs that you can trade that don’t seem to have this problem, such as the GBP/USD, EUR/USD, EUR/GBP, AUD/USD, AUD/NZD, USD/CAD, USD/CHF etc.

At the present time, it is simply not worth the risk trading any of the yen pairs. Capital preservation is everything in this profession.

Filed Under: News Tagged With: gbpjpy, price spikes, usdjpy, yen

S&P500 Shorting Opportunity at VWAP and Fib Levels – 20 October 2023

October 21, 2023 by James Woolley Leave a Comment

Introduction

As I am based in the UK, I don’t generally like to trade on Friday afternoons when the US markets open. I prefer to close out any positions before then and finish early for the week.

That’s because Friday’s price action can be difficult to predict, and if a trade does move against you, it is a horrible feeling to take a loss at the end of the week heading into the weekend.

The alternative is to hold a position over the weekend, but it can be very expensive because of the additional fees, and you run the risk of the market gapping up or down when it opens the following week, incurring even greater losses.

So I didn’t trade the S&P 500 at all yesterday, and didn’t even look at it until it closed, but I did notice a very high probability short set-up that I missed, and thought that it was worth discussing it in more detail.

Bearish Sentiment

With everything that is happening in the middle East right now, I think most traders would naturally be nervous about holding any long positions over the weekend, and may well have been looking for opportunities to short the S&P 500, expecting a sell-off heading into the close.

As it turns out, this is exactly what happened, and looking at the price action, there was an excellent opportunity to go short right in the middle of the session, prior to this.

VWAP and Fibonacci Confluence

The S&P500 was relatively strong at the open, hitting a high of around 4277, before the sellers and shorters came in, driving the price all the way down to a low of around 4230.

Some traders will have attempted to short the opening rally, expecting a sell-off, and some momentum traders will have jumped on board during this downward move, but traders who were late to the party still had a good chance to short the subsequent pull-back rally.

By applying the fibonacci tool to the high and the low of this downward move, you could have easily identified potential reversal points at the key 50% and 61.8% fib levels, and if you use the VWAP, like so many other traders, you will see that this indicator was sitting very close to these key levels as well, creating another strong resistance level that the price has to get through.

Subsequent Price Action

As you can see from the 5-minute chart of the S&P500, the 50% fib level and the VWAP (shown as a thick black line) were at exactly the same level initially, and the price immediately sold off at this area of confluence, as you might expect, giving a maximum profit of around 12 points.

The price then bounced back and briefly broke through the VWAP, attempting to test the important 61.8% level, but after making two attempts, this also acted as a strong resistance level and the price ended up making a decisive move below the VWAP back to the lows of the day.

Final Thoughts

The main point that I want to get across in this article is that when you have the VWAP and some key fibonacci levels at the same price levels, particularly after a big price move beforehand, this can present you with a high probability trading opportunity.

Traders will always be looking to trade VWAP reversals anyway, and if you have a strong 50% or 61.8% level close by (or both), this will only add to their conviction.

In this case you also had very bearish sentiment and nervousness about the markets generally due to geopolitical tensions, so all of these factors combined to give traders a very nice short set-up.

I know many traders don’t like to use fib levels, but this is one more tool that you can use to tilt the odds in your favour, so it should never be disgarded completely.

If you missed this particular trade, like myself, don’t worry because there will be always be many more like this in the future. You just need to keep your eye out for them.

Filed Under: Analysis Tagged With: fibonacci, s&p500, vwap

Inside Bar Breakout Trade on US Crude Oil – 11 October 2023

October 11, 2023 by James Woolley Leave a Comment

Trade Set-Up

The tragic events that took place in Gaza over the weekend unsurprisingly caused the price of oil to spike sharply upwards on Sunday evening and into the early hours of Monday morning.

However after hitting a high of $86.11, the price of US crude oil price subsequently dropped back, and much to the surprise of many oil traders, it did in fact trade sideways in a fairly subdued manner on Monday and Tuesday.

This set up an excellent trading opportunity for breakout traders because if you check out the daily chart below, you will see that there was a double inside bar set-up, with both bars trading within the range of Sunday’s bar, which is generally a high probability set-up:

Trade Execution

When you get a set-up like this, you can either wait for the price to break the high of Tuesday’s candle to go long, or wait for the price to break the low to go short.

For extra confirmation, you can wait for a breakout on a lower timeframe, followed by a retest and then a continuation breakout, but by doing this, you run the risk of missing the trade altogether if the price drives straight through the high or the low without pulling back to the entry level.

A lot depends on the pre-breakout price action. Ideally you want the price to consolidate near the breakout level for several candles, because then the price has the potential to move a lot further from the breakout level straight away, but this didn’t occur here.

Anyone taking the breakout on the 5-minute price chart, for example, would have noticed that there was a lot of choppy price action after the initial breakout, as well as a few price moves back above $84.00 that may have taken them out before the big drop lower occurred if they used a relatively tight stop loss on this lower timeframe.

That’s why it’s often better just to stick to the daily chart when trading inside bar breakouts, reduce your trade size and use wider stop losses instead.

If you had done that here, you could have entered a short position on the breakout, placed your stop loss at yesterday’s high and still banked an excellent profit based on a 1:1 risk reward, without having to worry about short-term volatility.

Indeed you wouldn’t have even seen this initial volatility on the daily chart if you were looking at the chart at the end of the day.

Closing Comments

I didn’t take this trade myself because I was away from my computer this afternoon, but I just wanted to discuss this set-up on US crude oil because you don’t see these double inside bars very often, particularly on a volatile market such as oil.

However they are always worth paying attention to because when the price does eventually break the high or the low of the most recent inside bar, you can get some very big price moves in the direction of the breakout, as was the case here with a price drop of over 180 points from the breakout level.

Filed Under: Analysis Tagged With: breakout, inside bar, oil, us crude

Missed Opportunity on the USD/CHF Pair Today (2 October 2023)

October 2, 2023 by James Woolley Leave a Comment

Introduction

Monday is often a difficult day to trade in my experience because there is often very little newsflow, and the currency pairs are slow to make their initial move for the week. For that reason I will often not enter any trades at all on the first day of the week.

Today was setting up to be the same old story because I wasn’t really seeing any potential set-ups that I liked, but then I spotted that the USD/CHF had been making a big move early on in the London session and was approaching a key monthly level.

One of my trading strategies is to scale into reversal trades when a market is extremely stretched in one direction and approaching one or more strong levels that are likely to act as resistance and potential turning points.

Trade Idea

The USD/CHF had already moved higher, hit another monthly level and reversed downwards during the overnight session, highlighting how well these levels are respected, and had fallen hard from a high of 0.9166 to a low of 0.9111.

So it had already exceeded it’s average daily trading range of 50 points by 8.30 AM (UK time), giving further weight to a likely reversal.

By placing an order to go long slightly lower down at 1 point above the monthly level of 0.9104, I thought that this would be a very high probability set-up, and was still prepared to enter a secondary long at a weekly level of 0.9089 if the price fell even more.

Sadly for me the price didn’t get down to either of these levels and I was left watching on from the sidelines as the price reversed at 0.9111 and then made a second low of 0.9110 before continuing to move higher during the rest of the morning.

Alternative Entry Point

In hindsight I should perhaps have entered when the bullish pin bar appeared (circled in the chart above) just above my preferred entry point because this is a good indication that the market is about to reverse, but I opted instead to wait for my optimal entry level to be hit.

Subsequently, I missed out on up to 80 points profit by not taking this alternative set-up.

Final Thoughts

Overall I’m not too disappointed at this missed opportunity because I don’t normally trade Mondays anyway, and this would just have been a bonus trade.

I can take satisfaction that the trade idea was correct. The price only needed to fall another 5 points to get me into my long position, but this happens all the time in forex trading.

There should hopefully be plenty more opportunities to make money during the rest of the week, particularly as we have more major news releases scheduled. These can help to create extremely stretched markets, and therefore high probability reversals at key weekly and monthly levels.

Filed Under: Analysis Tagged With: usdchf

USD/JPY Hits New High and Had Another Strong Month in September 2023

October 1, 2023 by James Woolley Leave a Comment

Introduction

As we enter a new month, we can see that the USD/JPY recorded another strong month in September. The price closed the month out at 1.4934, just 66 points off the key round number of 1.5000.

Subsequently, this was the 5th month out of the last 6 that this pair finished higher, which just underlines how strong this particular forex pair has been.

At the start of this 6-month period, the USD/JPY was trading at around 1.33, so the dollar has strengthened against the yen by over 12% during this time.

Where Does the USD/JPY Go From Here?

Many swing traders will now be asking themselves where the USD/JPY goes from here?

Does it break through the 1.50 level and continue heading higher, or is it more likely to fall back down?

As always, nobody knows for sure. We can only make educated predictions based on fundamental and technical analysis.

On a technical basis, it is obvious that 1.50 is likely to act as a strong resistance level in the near term.

A new high of 1.4971 was achieved on Wednesday, and many traders will be looking to see how the price reacts if it gets close to 1.50 once again this week or later this month.

Oscillating Indicators Point to a Possible Pullback

With such a sustained price rise, it is natural to assume that the traditional oscillating indicators that indicate whether a particular currency pair is overbought or oversold will show that the USD/JPY is overbought, and that’s exactly right in this case.

As you can see from the daily chart below, the RSI is very close to the 70 line and the stochastics indicator is well over above the overbought level of 80, suggesting that the USD/JPY is potentially overbought up here.

The weekly chart is even more emphatic because the RSI has just crossed above the 70 level on this timeframe, and the stochastic indicator is also well above the 80 level here as well.

Of course these are no guarantees that the USD/JPY will reverse. In fact it is extremely dangerous to take big positions based on RSI and stochastics indicators being overbought or oversold.

However they do form part of the overall picture, and when you consider that the price is trading close to the upper Bollinger bands in both of these timeframes, the odds do slightly favour a near term reversal at least.

No Key Levels if the Price Breaks Above 1.50

One problem that you have when a pair is hitting new highs is that you have no previous levels to work from if the price is making a new all-time high, or have to use very old levels from months or years ago in many cases, as is the case here.

The USD/JPY last traded over the key 1.50 level back in October 2022 for a very short period, and didn’t actually close above it, so you can’t even draw a level of resistance from the closing price. All you have is the monthly high of 1.5194 to work with.

So if the oscillating indicators are wrong and the price continues to make new highs above 1.50, it is running into clear air on the chart and could have a strong move up to 1.53, 1.54 or 1.55 in the coming months as there are no sellers above from previous levels, and the dollar is fundamentally strong thanks to the potential of one or two additional interest rate rises.

Final Thoughts

The USD/JPY is clearing running into a key level of 1.50 right now, and I personally think that it’s a difficult one to call because although the price looks technically overbought on both the daily and weekly chart, the fundamentals of the dollar are strong with the Fed already hinting that there may be one more interest rate rises this year.

So this is definitely a case of wait and see. Any hint of selling / profit taking could take the price down to 1.465 fairly quickly, which is around the level of the 50-day moving average, and possibly even a test of the 200-day moving average nearer to 1.40.

However if 1.50 offers little resistance and there is little selling around this level, there is definitely the potential for the price to break through 1.50 and clear the previous October 2022 high of 1.5194 because this is a fairly weak resistance level.

Filed Under: News Tagged With: usdjpy

Forex Rebates:

Choose from 40+ different forex brokers and crypto exchanges, and get cashback every time you trade:


Copy Profitable Traders:

If you join ZuluTrade, you can follow and subscribe to profitable traders and all of their trades will be automatically copied in your own trading account.

You can also earn money as a signal provider if you are already a profitable trader.

Click here to find out more

Recommended Broker:

Recent Blog Posts:

  • High Probability Trade on S&P 500 – 26 January 2024
  • Oanda Moves Into Prop Trading With Labs Trader Program
  • My eToro Performance in 2023 – Up 33.24%
  • The5ers Offering $20K Bootcamp Challenge For Just $1
  • Example of VWAP Bounce Trade on S&P 500 – 18 December 2023

Recent Articles:

VWAP Indicator
  • MA Sabres (LuxAlgo) Indicator
  • 10 Harsh Truths About Forex Trading
  • Best Websites for Monitoring Currency Strengths
  • Xmaster Formula Indicator for MT4 and MT5
  • Tools:

    Currency Heat Map

    Categories

    • Analysis
    • News

    Archives

    • January 2024
    • December 2023
    • November 2023
    • October 2023
    • September 2023
    • August 2023
    • July 2023
    • June 2023
    • May 2023
    • August 2020
    • June 2020
    • May 2020
    • April 2020
    • January 2020
    • December 2019
    • November 2019
    • October 2019
    • September 2019
    • August 2019
    • July 2019
    • June 2019
    • May 2019
    • April 2019
    • March 2019
    • February 2019
    • January 2019
    • December 2018
    • November 2018
    • October 2018
    • September 2018
    • August 2018
    • July 2018
    • June 2018
    • May 2018
    • March 2016
    • December 2015
    • November 2015
    • October 2015
    • August 2015
    • July 2015

    Disclaimer

    This website should be used for general information purposes only and in no way represents professional financial advice.

    Forex and CFD trading carries a high level of risk and it is possible to lose more than your initial deposit if using leveraged products.

    Copyright © 2025 · eleven40 Pro Theme on Genesis Framework · WordPress · Log in

    • About
    • Contact
    • Disclosure
    • Privacy Policy
    • Terms Of Service