2020 Price Action So Far
It is fair to say that 2020 has been a complete disaster for many stock market investors thanks to the global coronavirus pandemic that has effectively closed down the world’s economy.
You only have to look at the price chart of any mid-large cap stock, or any major stock market index for evidence of this.
The S&P 500 is a classic example. Even as recently as February, this index was closing in on 3400 and making new all time highs before the virus started spreading outside China.
However things really turned negative in March as the effects started to be felt in many countries all over the world, with thousands of new infections and rapidly growing death rates ultimately leading to complete lockdowns and the closure of many businesses.
Subsequently, the S&P 500 fell all the way down to around 2200 at one point, so it is quite remarkable that it has since recovered back up to the 2800 level.
Strong Resistance
At the moment, however, it is hard to see this upward price move continuing for much longer.
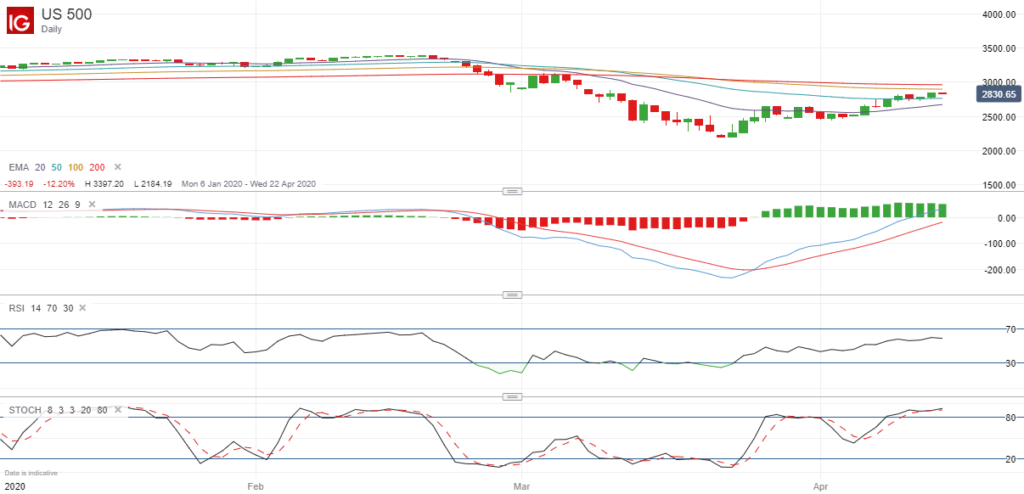
As I posted on my eToro feed yesterday, it is getting closer to its 200-day exponential moving average, which by itself often acts as strong resistance.
However the fact that this indicator is also very close to the 3000 level, ie a major round number, makes this even more significant because it is likely to provide even stronger resistance.
Here is the chart that I posted yesterday:
Since then, the S&P 500 has fallen from 2830 to it’s current overnight level of 2800, and all of the additional indicators are still suggesting that this market is currently in overbought territory and likely to fall, as you can see below:
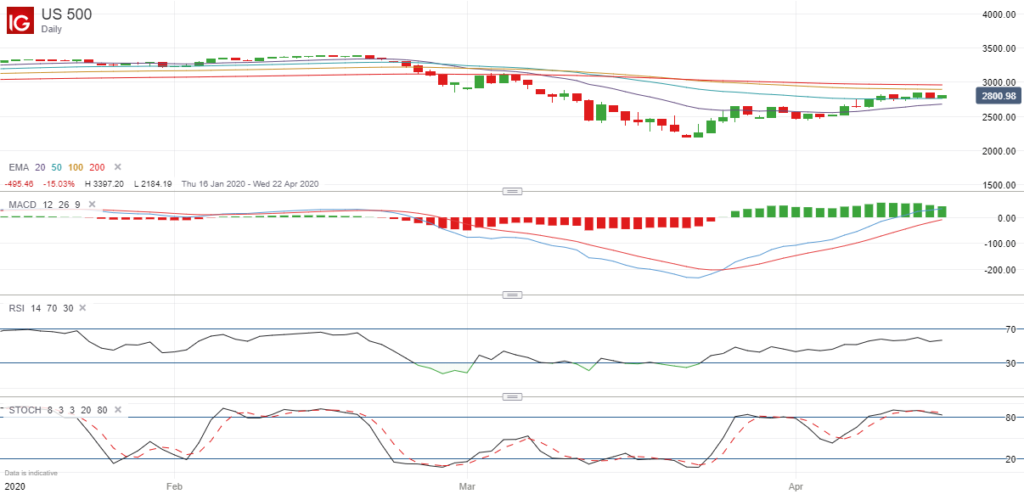
The MACD histogram is slowly falling as the price has been rising and the stochastic indicator is still above 80, suggesting it has potentially reached a peak. The only exception is the RSI indicator because this has not yet crossed above 70, suggesting that the price could yet go slightly higher.
However this latest price chart is still pointing towards further weakness in the coming days and weeks.
The Fundamental Argument
It is all well and good looking at the price charts to make trading decisions, but it is often good to look at the fundamentals as well.
The S&P 500 has been trading on a large P/E ratio for several years now, prompting many to sell their index ETFs, VOO, SPY, etc, and wait for a reversal to buy back in cheaper.
Even though the index is well below it’s all-time high, the fact remains that it is still trading on a very high multiple. As of yesterday, iShares’ IVV was still trading on a P/E ratio of 18.75, and this doesn’t really account for the fact that the earnings part of this formula is likely to fall sharply later this year, pushing the P/E up even further.
Final Thoughts
So these are some of the reasons why I think the S&P 500 is likely to fall in the near future. There are strong arguments both fundamentally and technically why the S&P 500 could easily drop to 2500 again, and possibly even further.
When you also take into consideration the fact that we are still a long way off developing a vaccine for COVID-19, and many countries are still in lockdown, it really is hard to put forward any arguments why this index should rise much further at the present time.

Leave a Reply