The Forex Chronicles

  • Rebates
  • Brokers
  • News
  • Analysis
  • Signals
    • Best Copy / Social Trading Platforms
    • eToro Review
    • FXTM Invest Review
    • Marketclub Review
    • ZuluTrade Review
  • Indicators
  • Strategies
  • Articles

5 Hourly Inside Bar Candles on the USD/JPY – 19 May 2023

May 21, 2023 by James Woolley Leave a Comment

Introduction

I have always been a big fan of inside bar set-ups because these provide you with a low-risk, high probability entry point that can potentially have high rewards.

You can either trade them on the shorter time frames, such as the 5 or 10-minute charts, for example, to scalp a few points, or you can use them on the 1 hour, 4 hour or daily time frame to target even bigger moves.

The reason why they work so well is because you get a wide trading range with the initial candle followed by a series of smaller indecisive candles that all trade within the range of this first bar.

So when the price does eventually break above the high or below the low of the first bar/candle, the move can be quick and decisive as it will often quickly gather momentum and continue moving in the direction of the breakout.

USD/JPY Set-Up

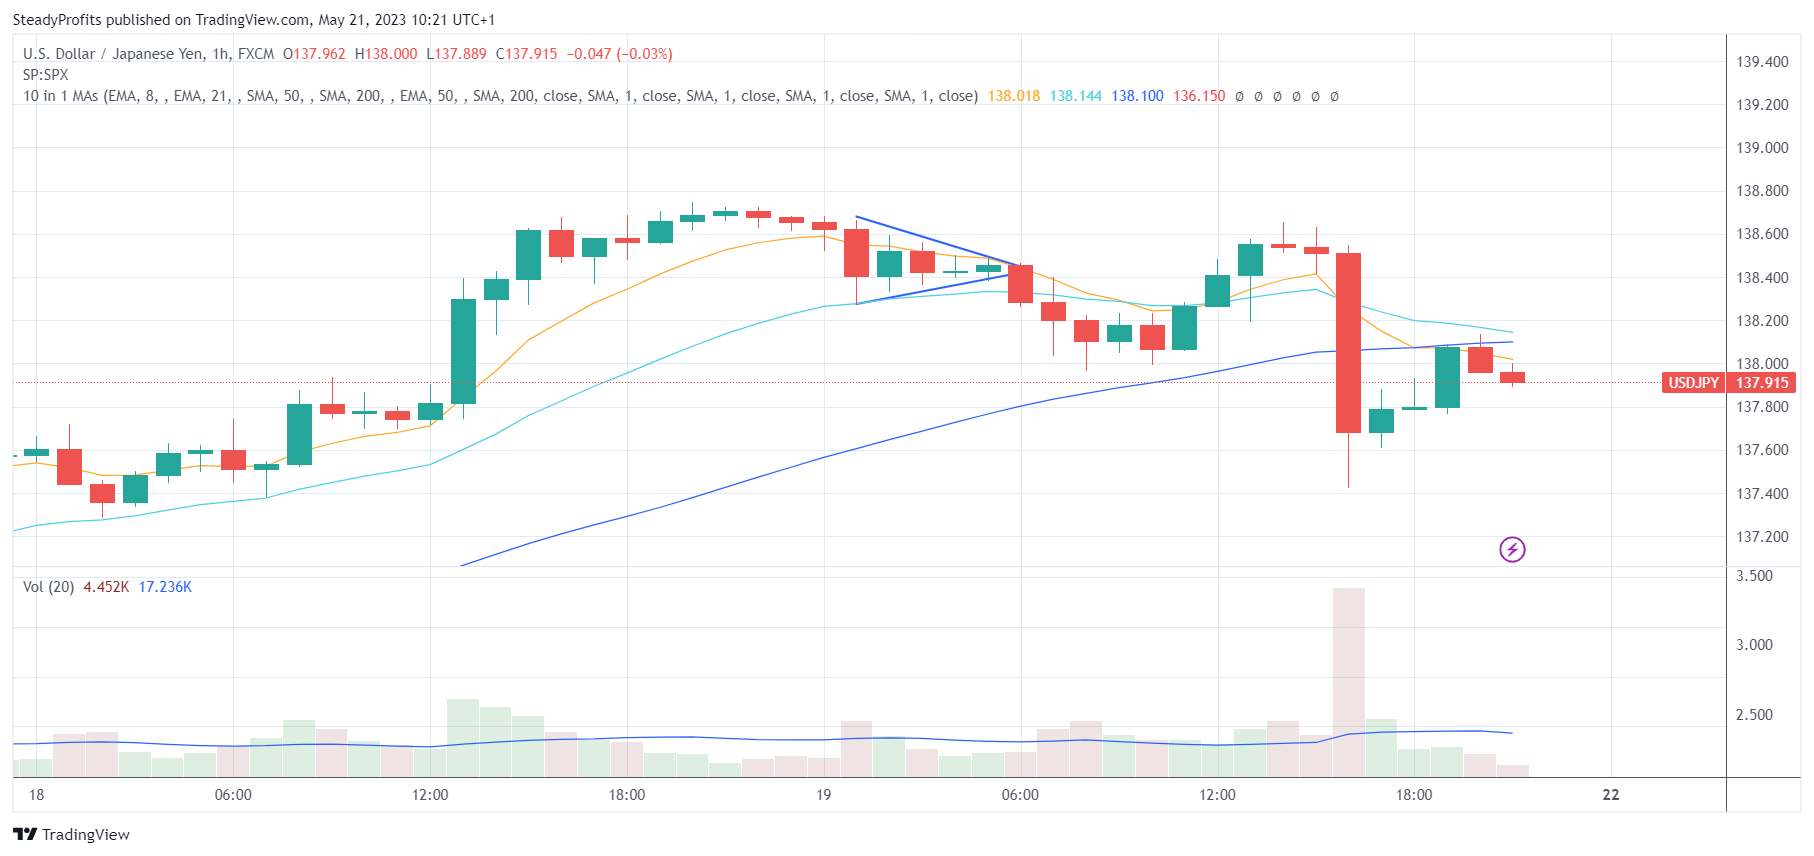
I wasn’t at my computer during the Asian and pre-London trading session on Friday (19 May 2023), but as I was reviewing my charts this weekend, I noticed what would have been a really great set-up on the 1 hour chart of the USD/JPY pair.

There was a large red candle at 1.00 AM UK time right at the start of the Asian trading session on the USD/JPY pair, followed by four very small candles that all traded within the range of this initial candle between 2 AM and 6 AM, as you can see below:

Trading Opportunity

With a narrow triangle forming on this inside bar set-up, it was only a matter of time before the price broke upwards or downwards out of this tight range, and when it did occur the hourly breakout candle closed at 7 AM, just when volume starts to pick up before the London market opens.

Therefore it was always likely to continue moving, and in this case if you had taken a short position at the close of the breakout candle at 138.28, you could have ridden it down to the 138.00 whole number or closed a partial for 28 pips profit, where it ended up finding support.

You could also have zoomed into the 1 or 5-minute chart to get an earlier entry point during the 1-hour breakout candle once it looked likely that this breakout was likely to continue.

Final Thoughts

Of course it’s easy to talk about these profitable set-ups after they have occurred, but the point is that these inside bar formations occur all the time, and when you a get a long extended set-up of 5 hourly candles in this case, the odds of success are extremely high when the breakout does eventually happen.

Therefore you always want to be scanning the charts of various pairs (on various time frames) to try to visually spot them when they are setting up because they can be very profitable to trade.

Filed Under: Analysis Tagged With: breakout, inside bar, usdjpy

Leave a Reply Cancel reply

Your email address will not be published. Required fields are marked *

Forex Rebates:

Choose from 40+ different forex brokers and crypto exchanges, and get cashback every time you trade:


Copy Profitable Traders:

If you join ZuluTrade, you can follow and subscribe to profitable traders and all of their trades will be automatically copied in your own trading account.

You can also earn money as a signal provider if you are already a profitable trader.

Click here to find out more

Recommended Broker:

Recent Blog Posts:

  • High Probability Trade on S&P 500 – 26 January 2024
  • Oanda Moves Into Prop Trading With Labs Trader Program
  • My eToro Performance in 2023 – Up 33.24%
  • The5ers Offering $20K Bootcamp Challenge For Just $1
  • Example of VWAP Bounce Trade on S&P 500 – 18 December 2023

Recent Articles:

VWAP Indicator
  • MA Sabres (LuxAlgo) Indicator
  • 10 Harsh Truths About Forex Trading
  • Best Websites for Monitoring Currency Strengths
  • Xmaster Formula Indicator for MT4 and MT5
  • Tools:

    Currency Heat Map

    Categories

    • Analysis
    • News

    Archives

    • January 2024
    • December 2023
    • November 2023
    • October 2023
    • September 2023
    • August 2023
    • July 2023
    • June 2023
    • May 2023
    • August 2020
    • June 2020
    • May 2020
    • April 2020
    • January 2020
    • December 2019
    • November 2019
    • October 2019
    • September 2019
    • August 2019
    • July 2019
    • June 2019
    • May 2019
    • April 2019
    • March 2019
    • February 2019
    • January 2019
    • December 2018
    • November 2018
    • October 2018
    • September 2018
    • August 2018
    • July 2018
    • June 2018
    • May 2018
    • March 2016
    • December 2015
    • November 2015
    • October 2015
    • August 2015
    • July 2015

    Disclaimer

    This website should be used for general information purposes only and in no way represents professional financial advice.

    Forex and CFD trading carries a high level of risk and it is possible to lose more than your initial deposit if using leveraged products.

    Copyright © 2025 · eleven40 Pro Theme on Genesis Framework · WordPress · Log in

    • About
    • Contact
    • Disclosure
    • Privacy Policy
    • Terms Of Service