The Forex Chronicles

  • Rebates
  • Brokers
  • News
  • Analysis
  • Signals
    • Best Copy / Social Trading Platforms
    • eToro Review
    • FXTM Invest Review
    • Marketclub Review
    • ZuluTrade Review
  • Indicators
  • Strategies
  • Articles

AUD/NZD Likely To Find Support At 1.0600

November 14, 2018 by James Woolley Leave a Comment

Price Action

The AUD/NZD pair has fallen quite dramatically in recent weeks. After posting a yearly high of 1.1176 back in August, it has since fallen all the way down to 1.0620, which is equivalent to a fall of 556 pips.

Looking further back in time, the price has generally been trading in a fairly predictable sideways trading range, generally fluctuating between 1.13 and 1.03, so there is nothing unusual in these recent price movements.

However the key point I want to make in this article is that the price is now approaching a key support level that may well prevent the price from falling a lot further.

Support Level

AUDNZD Weekly Chart - November 2018

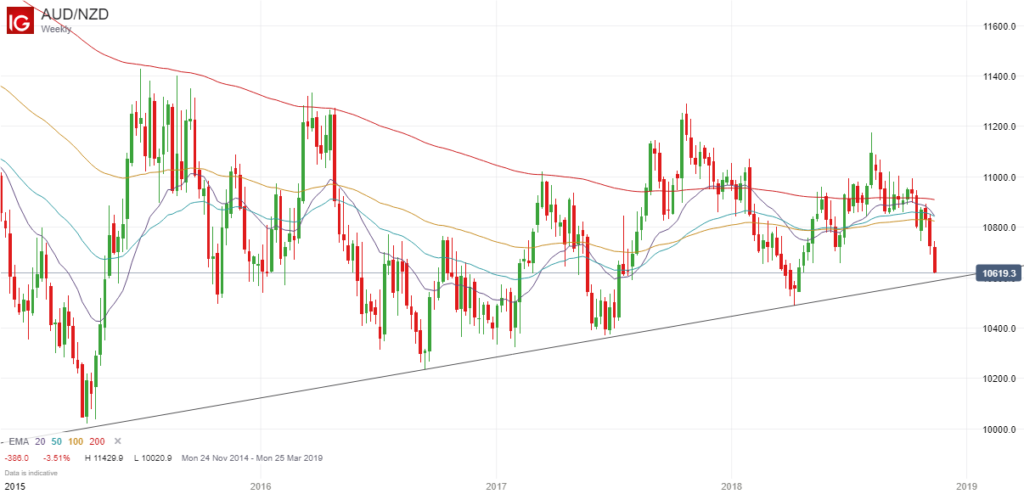
Although there has been a lot of sideways movement, if you look at the weekly chart above, you can see that the price has been slowly trending upwards since 2015 (indicated by the rising trendline), and has always found support when it has come close to this trendline, bouncing off it on 5 separate occasions.

Future Price Direction

Based on this key support level, you would have to say that the price is highly likely to reverse and move higher as it gets closer to this trendline.

Therefore as the trendline is currently around the 1.0600 level, it may be worth watching for possible reversal signals on the daily chart to look for opportunities to go long, although as always, I am not recommending any trades or offering any advice. These are just my own thoughts and opinions.

Pin bars and divergence patterns on indicators such as the RSI, stochastics and MACD are examples of some very effective reversal signals that are worth looking out for on the daily time frame.

The bigger picture is always best viewed on the weekly time frame, but it always a good idea to zoom down to shorter time frames, such as the daily time frame in this instance, in order to spot the reversal signals earlier and get a better entry point.

Profit Target

If the price were to move higher, there is the potential for the price to move back up to the 100 and 200-day exponential moving averages on the daily chart, which are currently around the 1.0860 mark, 240 pips higher, particularly as the 200-week moving average is currently around the same level.

However there are still no guarantees of anything at this stage because trendlines don’t last forever and the longer they go on, the more likely they are to be broken.

This is why there is a need to look for definitive reversals around this level rather than blindly opening long positions at 1.0600 in the hope that the trend will resume.

Filed Under: Analysis Tagged With: audnzd

Leave a Reply Cancel reply

Your email address will not be published. Required fields are marked *

Forex Rebates:

Choose from 40+ different forex brokers and crypto exchanges, and get cashback every time you trade:


Copy Profitable Traders:

If you join ZuluTrade, you can follow and subscribe to profitable traders and all of their trades will be automatically copied in your own trading account.

You can also earn money as a signal provider if you are already a profitable trader.

Click here to find out more

Recommended Broker:

Recent Blog Posts:

  • High Probability Trade on S&P 500 – 26 January 2024
  • Oanda Moves Into Prop Trading With Labs Trader Program
  • My eToro Performance in 2023 – Up 33.24%
  • The5ers Offering $20K Bootcamp Challenge For Just $1
  • Example of VWAP Bounce Trade on S&P 500 – 18 December 2023

Recent Articles:

VWAP Indicator
  • MA Sabres (LuxAlgo) Indicator
  • 10 Harsh Truths About Forex Trading
  • Best Websites for Monitoring Currency Strengths
  • Xmaster Formula Indicator for MT4 and MT5
  • Tools:

    Currency Heat Map

    Categories

    • Analysis
    • News

    Archives

    • January 2024
    • December 2023
    • November 2023
    • October 2023
    • September 2023
    • August 2023
    • July 2023
    • June 2023
    • May 2023
    • August 2020
    • June 2020
    • May 2020
    • April 2020
    • January 2020
    • December 2019
    • November 2019
    • October 2019
    • September 2019
    • August 2019
    • July 2019
    • June 2019
    • May 2019
    • April 2019
    • March 2019
    • February 2019
    • January 2019
    • December 2018
    • November 2018
    • October 2018
    • September 2018
    • August 2018
    • July 2018
    • June 2018
    • May 2018
    • March 2016
    • December 2015
    • November 2015
    • October 2015
    • August 2015
    • July 2015

    Disclaimer

    This website should be used for general information purposes only and in no way represents professional financial advice.

    Forex and CFD trading carries a high level of risk and it is possible to lose more than your initial deposit if using leveraged products.

    Copyright © 2025 · eleven40 Pro Theme on Genesis Framework · WordPress · Log in

    • About
    • Contact
    • Disclosure
    • Privacy Policy
    • Terms Of Service