Previous Trading Range
If you read my previous blog post that I wrote about the AUD/USD pair last month, you will know that I talked about a potential long-term breakout that could be about to take place on this particular currency pair. Here is the original price chart:
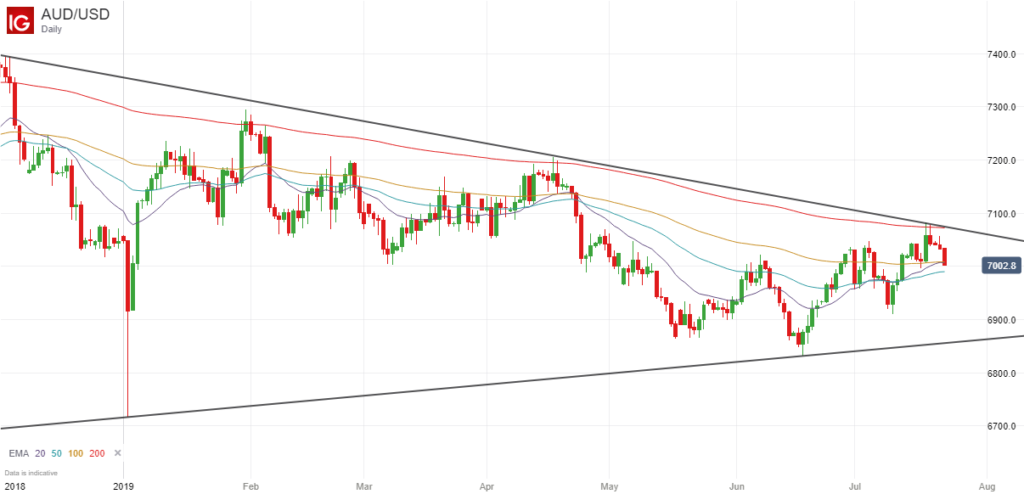
The price had been trading within a clearly defined trading range for the whole of 2019, and so it seemed like it was only a matter of time before the price broke strongly upwards or downwards out of this range.
July / August Breakout
I actually thought that we would eventually see an upward breakout, but as you can see from the daily price chart below, the price actually broke lower, and more importantly, closed below the lower trendline on the last month of July.
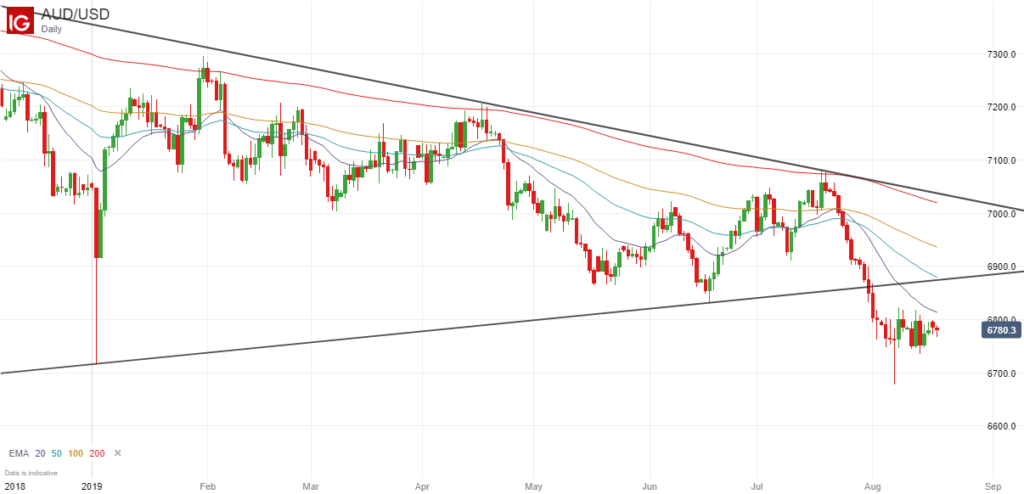
Subsequently, the momentum of this breakout helped to drive the price lower into August, hitting a low of around 0.6677 on 7 August before bouncing back.
I said in my previous blog post that I think the price may find support at the previous low, which was caused by the flash crash back in January, and this proved to be correct because although the price did go slightly lower than this on an intraday basis on 7 August, it soon found strong support at this level and bounced back towards 0.68.
Future Direction
After finding support at the previous low, it is hard to argue that the price of the AUD/USD is likely to continue falling much more.
This is a long established downward trend, but after the previous breakout and the subsequent rebound, it is starting to look like it is close to the bottom now.
Therefore I would say that in the near future at least, the price is likely to move back towards its 200-day moving average, which is currently just above the 0.70 level, and back into its previous trading range.
After that, the previous downward trend could prevail and the price could easily fall again, or we could finally see the start of a new upward trend, but for that to happen we really need to see the price close strongly above the 200-day exponential moving average.
If the short-term moving averages cross above this indicator as well, then there could well be a longer sustained upward move in the future.
Final Thoughts
The point I wanted to make is that it can be very profitable to wait for these breakouts to occur, particularly when a pair has been trading in a clearly defined trend for many months, as was the case here.
In this instance you could have banked up to 172 points if you had entered a short position at the close of the breakout candle and closed at the lowest point on 7 August.
Of course the hard part is deciding when to close because it is virtually impossible to get out at just the right time, but there were still plenty of opportunities to make money because you could have set your price target at 50, 100 or 150 points, for instance, which were all realistic targets, or closed incrementally as the price continued to fall.
These breakouts require a lot of patience because the price may be stuck in a trading range for many months, but when they occur, they can be very rewarding.

Leave a Reply