Recent Price Action
As an investor in a few oil stocks, I tend to watch the oil price very closely, and it is fair to say that the price of this commodity has been very volatile so far in 2019.
The price of Brent crude fell sharply in the last few months of 2018, but it has since rallied from a low of just over $50 to around $75 at the end of April.
After that, it then fell back towards $60 as we entered the summer, but it has once again bounced back as a result of renewed tensions in the middle east.
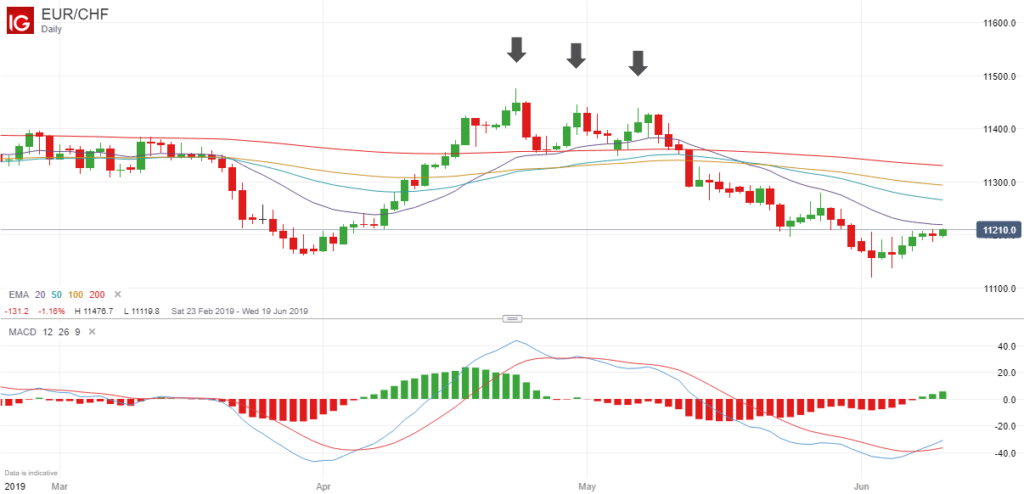
Inside Bar Breakouts
Ordinarily it would be very difficult to predict these large price swings, but one way you can potentially profit from these price movements is to wait for inside bar breakouts.
These occur when you have a large candle on the daily chart, followed by three or more candles / bars (the more the better) that all trade within the range of the initial candle, and then a breakout candle where the price closes outside the range of this candle.
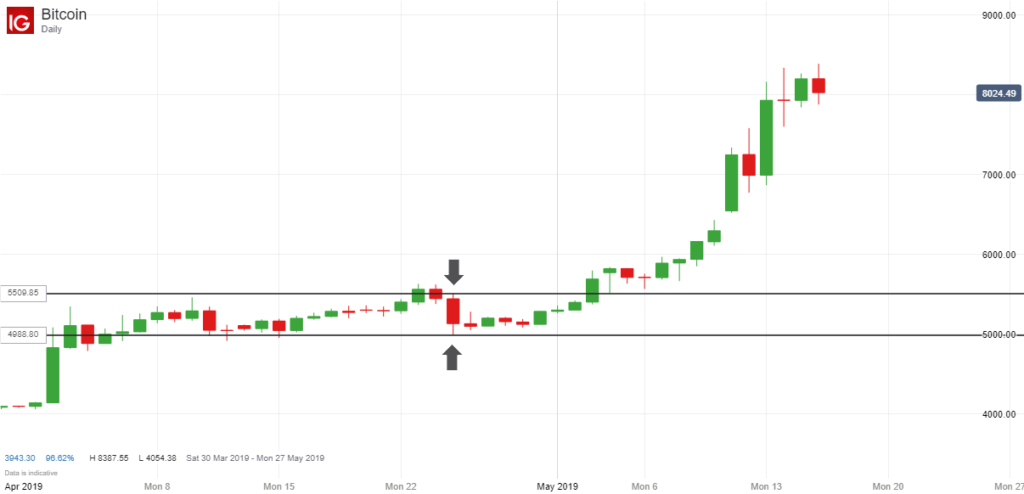
These breakouts are generally very reliable and will often have a lot of momentum behind them, and there have been two of these in the last month alone.
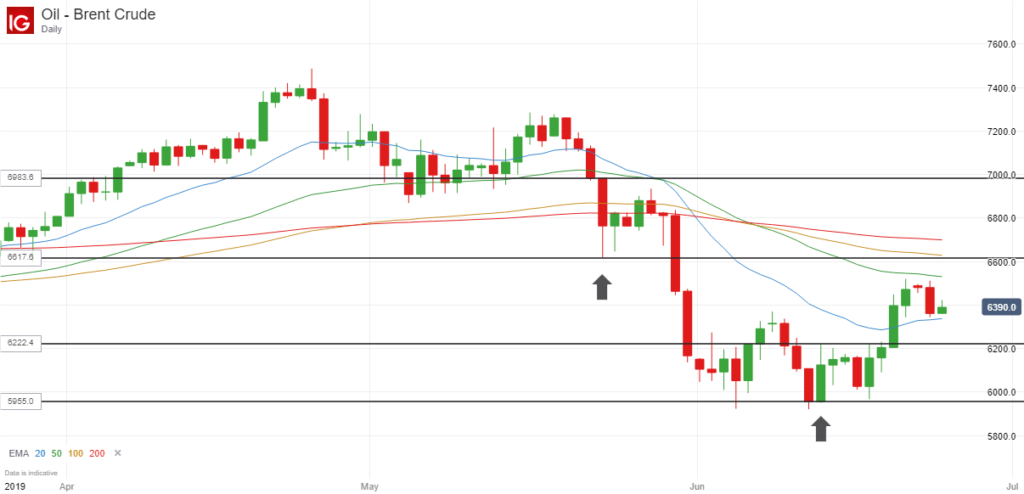
As you can see from the chart above, the first one occurred at the end of last month. On 23 May the price dropped below the 200-day moving average, which is significant in itself, but then the price traded within the range of this strong downward candle on five subsequent days (if you include the Sunday trading session).
So this was a good period of consolidation, and when the price of Brent crude subsequently closed below the range of the initial candle one week later, this would have been a great opportunity to open a short position.
In this particular instance the price went from around $64.62 to a low of around $59.27. Therefore it would have been a very profitable trade.
The second inside bar breakout has occurred more recently, and is still in progress as I write this article. After dropping back to the $60 level, there was a strong bullish candle on 13 June followed by three inside bars.
On this occasion it took a while for the price to close outside the range of the initial candle, but there was eventually a strong bullish candle that confirmed the recovery, and the price did move over 100 points in profit (and is still in progress) after closing at around $64 on the breakout.
Closing Comments
Once again this proves the overall effectiveness of inside bar breakouts, and as I have demonstrated in several posts previously, these breakouts are worth looking out for on the daily charts of many different markets, whether it’s currencies, commodities or cryptocurrencies, for example.
Generally speaking, the longer the price trades within the range of the initial set-up bar, the stronger the breakout. You just need to be patient enough to wait for them to occur because they don’t happen that often.