The Forex Chronicles

  • Rebates
  • Brokers
  • News
  • Analysis
  • Signals
    • Best Copy / Social Trading Platforms
    • eToro Review
    • FXTM Invest Review
    • Marketclub Review
    • ZuluTrade Review
  • Indicators
  • Strategies
  • Articles

Gold Breaks Below $1300 – March 2019

March 4, 2019 by James Woolley Leave a Comment

Introduction

With the major stock markets surging higher in 2019, I think many people naturally assumed that the price of gold would struggle to stay above $1300. I know I certainly did because I made this exact point in previous blog posts.

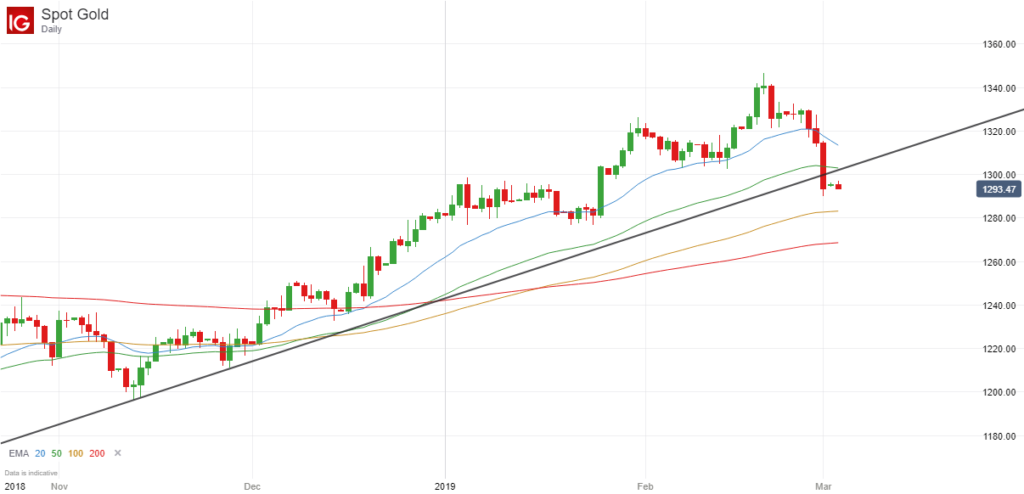
Well it has taken a while because the price of gold headed to around $1345 a few weeks ago, but it has since fallen back sharply and is now trading below $1300 at around $1293.5 at the time of writing.

Indeed this was apparently the biggest weekly decline since August 2018, which shows just how strong a move this actually was last week.

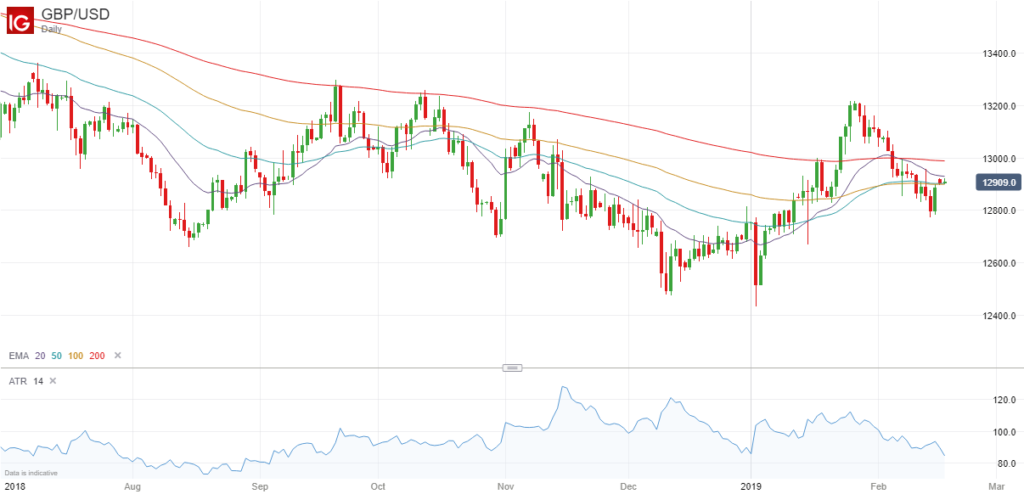
It is not an insignificant move either because if you look at the long-term daily chart below, you can see that it has broken below the upward trendline that has been in place since November last year:

Gold Daily Chart - 4 March 2019

The question is; where does it go from here?

Future Price Direction

It is actually very difficult to call this market right now because it largely depends on what the stock markets do in the coming weeks, and these too are difficult to call.

With Britain scheduled to leave the European Union at the end of this month, and Donald Trump’s comments and actions continuing to weigh heavily on the markets, nobody can really be sure if the markets are going to continue to move higher in the future, or whether they will finally start to run out of momentum and fall back.

Brexit alone is causing so much uncertainty because it is looking increasingly unlikely that there will be a firm resolution before the official exit date, and the USA’s future relationship with China and other countries isn’t any clearer.

So all we can really do is to rely on technical analysis to guide us with regards to the gold price, and in that respect you would have to say that gold may well struggle to break back above the $1300 level now that it has broken below this significant round number.

Looking further ahead, further weakness is likely and I would say that there is every chance that the price will move towards the 200-day exponential moving average at some point, which currently stands at around $1268.

Trading Opportunity

Although I am predicting further weakness below $1300, I wouldn’t necessarily say that this is a strong trading opportunity right now because it doesn’t really represent a high-probability trade.

With gold and other commodities, I think it is better to wait for a period of consolidation where the markets are range-bound for several weeks, and then trade the resulting breakout, similar to what we saw at the January when the price rocketed above $1300 after several weeks of sideways movement.

So it is probably better to wait and see if the price stays around the 1290-1300 level for several days because if this occurs, then a downward breakout could be a very profitable trade.

Filed Under: News Tagged With: gold, gold price

eToro Trading Update – February 2019

February 27, 2019 by James Woolley Leave a Comment

A Profitable February

After the dramatic stock market falls that we saw in December (just after I started trading on eToro) and the rebound that we saw in January, it is fair to say that February has been a lot quieter in comparison.

Nevertheless, I did manage to post some small gains from my trading (my portfolio is currently up 1.49% for the month with just a few trading days left), and the good news is that at the time of writing, my portfolio is now in profit overall, as you can see from the chart below:

SteadyProfits eToro Performance Chart - February 2019

A notional starting balance of $10,000 is now worth $10,138.76, which is not bad at all because despite all the turmoil, it represents an overall gain of around 1.39%.

Of course I would have liked to have made a lot more in the last 3 months, but it was a difficult time to be invested in stocks, and overall I am fairly content with my current portfolio and its future growth and dividend-earning potential.

Here are the monthly returns for January and February 2019 so far:

SteadyProfits eToro Stats – February 2019

Current Portfolio

After having quite a lot of spare cash sitting on the sidelines, I am now almost fully invested.

My portfolio is currently 100% in stocks, and my largest holding is still GVC (GVC.L), the global sports betting company that is rapidly expanding into the US market with a joint venture partnership with MGM.

They are due to report their latest trading results next week, and as is so often the case, the markets are expecting some more solid results, with a possible dividend increase to come.

The share price has actually been trading at very low levels with the gaming sector currently out of favour, but it has bounced back sharply this week, and is now not far below my average entry price.

Apart from this, I still have a decent holding in Apple (AAPL), which is currently in profit, but I am not planning to sell this until it is at least $200.

I decided to buy into two banking stocks this month, namely Barclays (BARC.L) and HSBC (HSBA.L), which has had mixed results, but it is still early days.

Barclays is up nearly 4.74% at the time of writing, but this will be reduced back towards my initial entry price because it goes ex-dividend tomorrow.

However at least the dividend goes straight into your account on this date with eToro, and you don’t have to pay until the official payment date, even though you only receive 85% of the total dividend payout.

HSBC is actually down a similar amount right now (4.33%), but it has recently gone ex-dividend. So this running loss has been negated somewhat by the 2% dividend that I received last week, and there are more dividends due every three months.

Finally, I also decided to buy Domino’s Pizza (DOM.L) this month because this is another good dividend stock, and is currently very undervalued based on future projections for the next few years.

With regards to outgoings, I sold my FTSE 100 tracker (ISF.L) and my holding in British American Tobacco (BATS.L) for a decent profit of 2.41% and 4.03% respectively, and also closed out my investment in Philip Morris (PM) for a very small profit, but this has turned out to be a mistake in hindsight because it has continued to surge higher.

Dividends

As I mention in my bio, dividends are very important to me, which is why I will predominantly trade stocks and ETFs that pay decent dividends, regardless of whether I am trading with a short-term or a long-term view.

Capital growth is great, but over time the effect of reinvested dividends cannot be underestimated, and the good news is that more and more dividends are now starting to be added to my portfolio.

This month I received dividends from Apple and HSBC, and I have another generous dividend payout from Barclays due tomorrow morning. Plus there is also a large dividend payout from GVC scheduled for next month, as well a final dividend from Domino’s Pizza to look forward to.

Closing Comments

My first few months trading on eToro were fairly tough due to the plunging markets, but I am very happy with my performance in 2019 so far because I am now back in profit and regular dividends are now starting to come through.

I didn’t actively trade that much this month because the markets are very high and there are few bargains to be had, but I am still happy to have picked up some shares in Barclays, HSBC and Domino’s Pizza, which should do well in the long run.

The only real disappointment is that I still don’t have any active copiers, but I’m sure that will come in due course if I can continue to grow my portfolio.

Follow Me on eToro

If you would like to follow my journey on eToro, simply go to the eToro website and search for SteadyProfits to view my live trading results and to see my latest trades.

Past performance is not an indication of future results. This content is for information and educational purposes only and should not be considered investment advice nor portfolio management. 81% of retail investor accounts lose money when trading CFDs with this provider.

Filed Under: News Tagged With: etoro, steadyprofits

Gold, Oil and Stock Markets All Looking Strong – February 2019

February 19, 2019 by James Woolley Leave a Comment

Markets Summary

It has been very interesting to see how the markets have traded in the first few months of 2019, and I think it is fair to say that many people will have been surprised by just how high they have gone.

After crashing in November and December to panic-inducing lows, the Dow Jones has staged a remarkable turnaround, and is now just over 1000 points off its all time high at the time of writing.

Dow Jones Daily Chart - 19 February 2019

It wasn’t long ago that the Dow Jones was trading as low as 21,500, and everyone was predicting it would go much lower, but it is currently up to 25,890 and the strong upward trend is showing no signs that it is potentially coming to an end.

The same can be said for the FTSE 100. It was trading between 6600 and 6800 for quite a long time towards the end of last year, and some experts were predicting that it would fall to around 6000, but it is now trading above 7200, and could continue to edge higher throughout 2019.

Normally with such strong stock markets around the world, you might expect that the price of gold would have dropped because people naturally tend to sell some of their gold and invest the proceeds into stocks when the markets are rising. However this hasn’t happened at all, and the price of gold has actually risen strongly above the previous resistance level of $1300.

Finally, there is one other market that has risen strongly in recent weeks, and that’s the oil market. The price of both Brent crude and US crude oil has risen sharply, and they currently stand at $66.60 and $56.45 respectively.

Time To Short These Markets?

The question many traders are now asking themselves is; is this a good time to open short positions on some of these markets?

My own view is that all of these markets are now looking seriously overbought according to many different indicators, but that doesn’t necessarily mean that this is a good time to go short.

They were also looking overbought one week ago, and indeed two weeks ago, for example, but have still continued to move higher.

Closing Comments

The point I really want to get across is that trying to call the top of a strong rising market is a very dangerous game. Yes you may get lucky at times when all your technical indicators seem to suggest that it is set to reverse, but the price can easily continue to go higher and potentially take out your stop loss if you are not careful.

I myself have been wrong with some of my predictions on this blog because I thought the Dow Jones and US crude would both run into resistance and move lower, but the price of both of these markets just went straight through these resistance levels.

So it is often a much better strategy to find a strategy that trades in the same direction as the prevailing trend when the markets are rising so strongly. Of course these markets can’t keep on rising forever and there will eventually be a reversal, but trying to predict when this will occur is never easy.

Filed Under: Analysis Tagged With: dow jones, gold, oil

Brexit is Still Making the GBP/USD Impossible to Trade in 2019

February 18, 2019 by James Woolley Leave a Comment

Introduction

The official date that Britain leaves the European Union (29 March 2019) is getting ever closer, but there is still just as much uncertainty as ever.

Nobody really knows if we will be leaving the EU on this date without a deal, or if this date will be extended in order for all parties to reach some kind of agreement.

Indeed there is still an outside chance that a second referendum will take place at some point in 2019.

This all means that it is practically impossible to predict where the pound pairs, such as the GBP/USD pair, for example, will be trading in the coming months.

GBP/USD Price Chart

If you take a look at the daily price chart of the GBP/USD pair below, you can see that this is reflected in the price action because the price has been drifting upwards and downwards between about 1.25 and 1.32 for several months now:

ATR of GBPUSD Pair - February 2019

Sometimes it will move a little higher on any news that a deal is looking more likely, and other times it will drift lower when the odds of leaving without a deal have increased.

Regardless, the daily price moves are now relatively mooted because you can see that the average true range has dropped to around 85 points, which also makes it fairly difficult to trade with any real conviction.

Finally, you will also notice that the moving averages that I have plotted on the chart, ie the 20, 50, 100 and 200-day exponential moving averages are all tightly packed together, as they are on the weekly chart, which once again highlights a real period of uncertainty.

Closing Comments

So the point is that you should be very wary of trading the GBP/USD pair right now because of the ongoing uncertainty surrounding Brexit.

I’m sure the price will eventually break strongly upwards or downwards once we have a firm agreement in place between Britain and the EU, but for now nobody really knows what is going to happen in the coming weeks and months, including Theresa May and her fellow MPs.

The GBP/USD could easily rise to at least 1.40 if we can somehow salvage a clean Brexit, but it could just as easily crash to 1.20 or lower if we crash out of Europe without a deal.

However it is too hard to predict right now, and so you would be very foolish to take any long-term positions on this pair, and with the daily price swings being relatively small, it is not exactly a great pair to day trade either.

So in the meantime you are probably better off trading some of the other major currency pairs until a clearer picture emerges.

Filed Under: Analysis Tagged With: brexit, gbpusd

USD/JPY May Be Poised for an Inside Bar Breakout – February 2019

February 11, 2019 by James Woolley Leave a Comment

Price Action

The US dollar has been very strong in recent weeks, as you can see for yourself if you look at the charts of the various dollar pairs.

However in this article I want to take a closer look at the USD/JPY pair in particular because although this pair is also trading higher, and is now close to the 110 level, it could also be gearing itself for a breakout.

It is not yet clear which direction this breakout will be, but we have had a lot of sideways price action in recent days, and the exponential moving averages are starting to converge on the daily chart and are all trading very close to each other (which often happens before a significant breakout):

USDJPY Inside Bar Formation - February 2019

Inside Bar Formation

Most importantly of all, you can see from the chart above that we now have an inside bar formation where the last 5 candles (6 if you include the Sunday candle) are all trading within the range of the large candle from last Monday (indicated by the two black lines).

This is one of the main things I like to look for when trying to identify possible breakouts because the longer the price trades within the range of a previous candle, the more likely it is for the price to break strongly upwards or downwards when it eventually closes outside of this range.

Trading Opportunity

Subsequently, it might be worth watching the price of the USD/JPY over the coming days to see if it can break decisively out of this range. The high from the initial set-up candle is 110.16 and the low is 109.44, so these are the key levels to look out for.

Some people like to jump into a trade as soon as the price moves above or below the high or the low, but I personally think it is better to wait for the daily candle to close to see if it actually closes outside of the range. Then it is far more likely to be a confirmed breakout in my experience.

If it breaks higher, then the 200-day moving average is an obvious price target, which currently stands at 111, but I wouldn’t be at all surprised to see the price continue to break above this moving average to around 112.

If, on the other hand, it breaks lower, then I would expect it to test its recent low from last month, which is about 108.5, and possibly go as low as 108, but we will just have to wait and see what happens.

Please bear in mind that these are just my own thoughts and opinions, and it doesn’t represent professional financial or trading advice in any way.

Filed Under: Analysis Tagged With: breakout, inside bar, usdjpy

  • « Previous Page
  • 1
  • …
  • 12
  • 13
  • 14
  • 15
  • 16
  • …
  • 29
  • Next Page »

Forex Rebates:

Choose from 40+ different forex brokers and crypto exchanges, and get cashback every time you trade:


Copy Profitable Traders:

If you join ZuluTrade, you can follow and subscribe to profitable traders and all of their trades will be automatically copied in your own trading account.

You can also earn money as a signal provider if you are already a profitable trader.

Click here to find out more

Recommended Broker:

Recent Blog Posts:

  • High Probability Trade on S&P 500 – 26 January 2024
  • Oanda Moves Into Prop Trading With Labs Trader Program
  • My eToro Performance in 2023 – Up 33.24%
  • The5ers Offering $20K Bootcamp Challenge For Just $1
  • Example of VWAP Bounce Trade on S&P 500 – 18 December 2023

Recent Articles:

VWAP Indicator
  • MA Sabres (LuxAlgo) Indicator
  • 10 Harsh Truths About Forex Trading
  • Best Websites for Monitoring Currency Strengths
  • Xmaster Formula Indicator for MT4 and MT5
  • Tools:

    Currency Heat Map

    Categories

    • Analysis
    • News

    Archives

    • January 2024
    • December 2023
    • November 2023
    • October 2023
    • September 2023
    • August 2023
    • July 2023
    • June 2023
    • May 2023
    • August 2020
    • June 2020
    • May 2020
    • April 2020
    • January 2020
    • December 2019
    • November 2019
    • October 2019
    • September 2019
    • August 2019
    • July 2019
    • June 2019
    • May 2019
    • April 2019
    • March 2019
    • February 2019
    • January 2019
    • December 2018
    • November 2018
    • October 2018
    • September 2018
    • August 2018
    • July 2018
    • June 2018
    • May 2018
    • March 2016
    • December 2015
    • November 2015
    • October 2015
    • August 2015
    • July 2015

    Disclaimer

    This website should be used for general information purposes only and in no way represents professional financial advice.

    Forex and CFD trading carries a high level of risk and it is possible to lose more than your initial deposit if using leveraged products.

    Copyright © 2026 · eleven40 Pro Theme on Genesis Framework · WordPress · Log in

    • About
    • Contact
    • Disclosure
    • Privacy Policy
    • Terms Of Service
    We use cookies to ensure that we give you the best experience on our website. If you continue to use this site we will assume that you are happy with it.OK