The Forex Chronicles

  • Rebates
  • Brokers
  • News
  • Analysis
  • Signals
    • Best Copy / Social Trading Platforms
    • eToro Review
    • FXTM Invest Review
    • Marketclub Review
    • ZuluTrade Review
  • Indicators
  • Strategies
  • Articles

The EUR/USD is Bearish on all Time Frames in February 2019

February 6, 2019 by James Woolley Leave a Comment

Identifying Trends

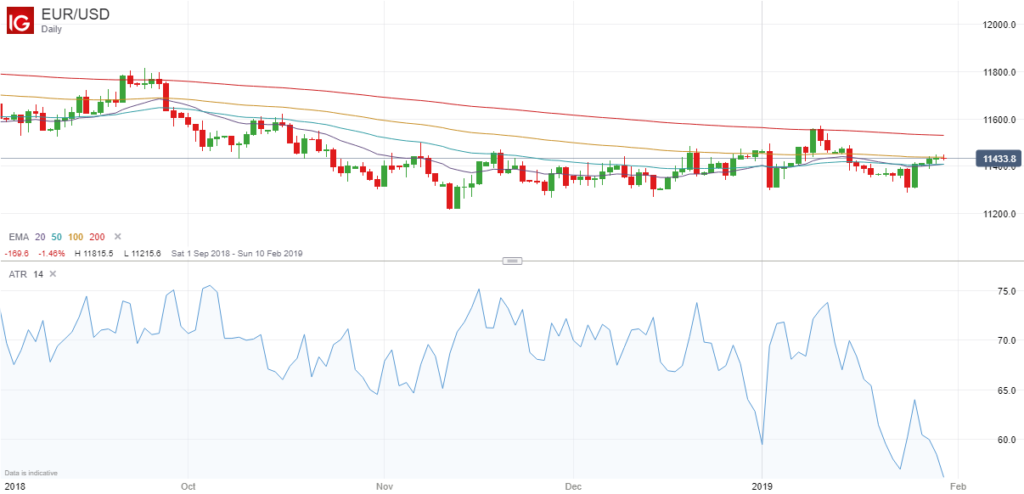
One way of identifying whether a particular forex pair is trending upwards or downwards is to simply plot a series of short, medium and long-term moving averages on your price chart.

I like to use the 20, 50, 100 and 200-period exponential moving averages (EMAs), but you can use simple or weighted moving averages, or use different periods if you prefer.

The point is that if the price is currently trading above all of these moving averages, then it is currently in a positive upward trend, and if it is currently trading below all of these moving averages, it is now in a downward trend.

The EUR/USD Trend

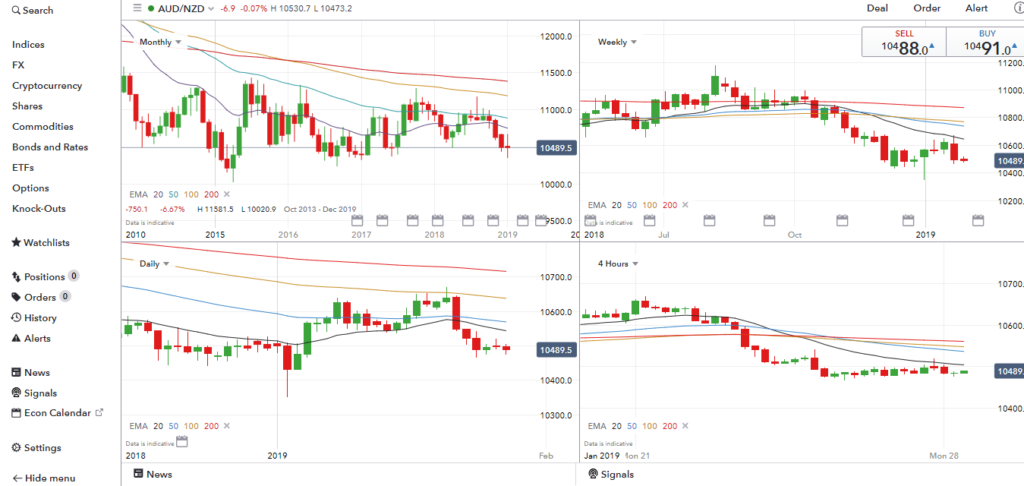
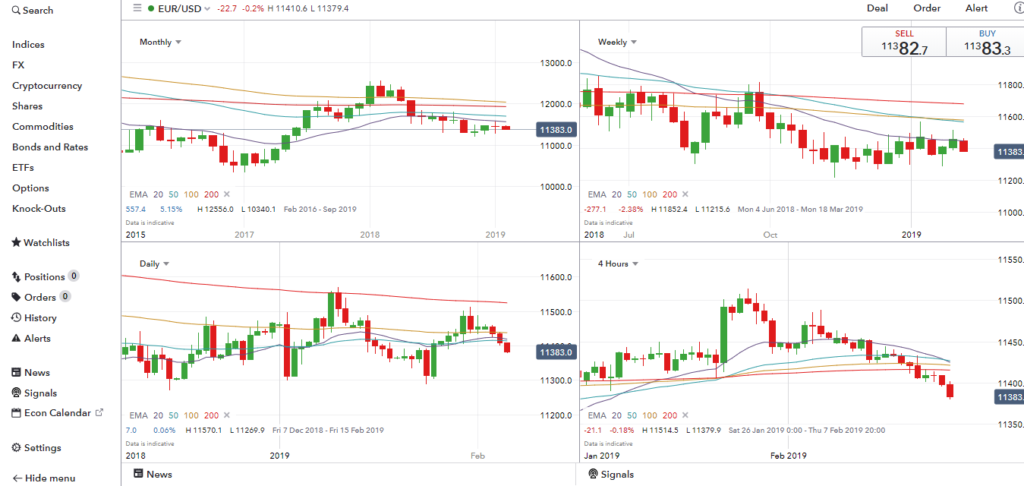
If you really want to see the bigger picture, you can plot these moving averages on multiple time frames, and if you do this for the EUR/USD pair, you will see that it is generally trading below these moving averages on every time frame.

This is true for the monthly, weekly, daily, 4-hour, 1-hour and 15-minute time frame, so it is clear that this pair is in a very strong downward trend right now.

EURUSD Charts - February 2019

How to Trade the EUR/USD Pair

The question is; how can you use this information to successfully trade the EUR/USD pair going forward?

Well a lot of currency traders will be looking to trade a possible reversal because there is sure to be some kind of bounce at some stage. After all, it can’t keep on falling forever. Therefore they may be looking for some kind of divergence or a significant pin bar, for example, for a chance to go long.

However this is a very risky strategy because as I said above, this pair is in a downward trend on multiple time frames, so you are always trading against the prevailing trend.

A much better strategy would be to wait for a significant pull-back and then wait for an opportunity to go short as soon as it looks like it is going to turn downwards again. That’s because it is much easier to trade with the overall trend rather than against it.

As always, I am not offering any professional trading or financial advice. I just wanted to highlight how strong the US dollar is right now, and how weak the Euro is right now because the EUR/USD pair is looking seriously bearish on pretty much every single time frame.

Filed Under: Analysis Tagged With: eurusd

eToro Removes 12-Month Performance Stats from Profile Pages

February 4, 2019 by James Woolley Leave a Comment

Profile Page Changes on eToro

If you are a trader or a copier on eToro, you will know that everybody’s profile page used to show their overall profit (as a percentage) for the previous 12 months.

This was quite useful because it obviously gave an instant snapshot into how successful a particular trader or copier has been for the last year.

They also used to show how much profit or loss each person made during the last trading day, which many people liked to see as well.

However it would appear that eToro have decided to remove both the 12-month performance figure and the profit percentage from the previous day from each person’s profile page.

To show you what I mean, this is what my previous profile page used to look like…

SteadyProfits eToro Profile Page as of 13 December 2018

… and this is what the new profile page looks like…

SteadyProfits eToro Profile Page - 4 February 2019

(click here to take a closer look at my profile page on eToro)

Why Have They Done This?

The cynic in me thinks that they have done this because so many of the traders on eToro lost a lot of money during the previous 12 months when the price of all the major cryptocurrencies crashed, and the stock market crash in November and December only added to these losses in many cases.

Therefore because so many traders are nursing heavy losses from the previous 12 months, it will only discourage people from opening a new account or investing money if they see many traders sitting on big losses when they view their profile pages.

Of course people can still see their trading results by looking at each person’s Stats page, which shows their entire trading history from the time they first started trading.

However the key point here is that last emphasis is placed on the results from the previous 12 months and the results from the previous day because these figures are no longer quoted.

My Thoughts

In many ways this may be a smart move because the most profitable traders and investors will make money in the long run, but are still capable of having losing days, months or years.

So this may be the real reason why eToro have decided to remove these two performance figures. They may simply want to encourage people to look at people’s overall track record rather than encouraging people to invest money into copiers who have impressive trading records from the previous 12 months.

It’s not really that important, whatever the reasons. I just thought I would mention this change because it will affect both traders and copiers on eToro.

Past performance is not an indication of future results. This content is for information and educational purposes only and should not be considered investment advice nor portfolio management. 81% of retail investor accounts lose money when trading CFDs with this provider.

Filed Under: News Tagged With: etoro, steadyprofits

eToro Trading Update – 31 January 2019

January 31, 2019 by James Woolley Leave a Comment

A Profitable January

It is fair to say that my account is still suffering from the drubbing it took in November and December, which as I said before, was one of the worst times that I could have opened an account and started trading stocks.

Nevertheless I’m not overly concerned because my eToro account (SteadyProfits) has recovered quite well in January, and I see this as a long-term game rather than a short-term road to riches.

At the time of writing, my account is up 4.23% this month with just one trading day left, but overall it is still down 4.88% since I first started trading in November.

SteadyProfits Trading Performance - January 2019

(In reality my account is only down 0.82%, but I made the mistake of making a big deposit when I was in profit for the month, which has negatively distorted my performance results for the year).

Portfolio Analysis

After Apple (AAPL) and British American Tobacco (BATS.L) both surged higher this week, my overall portfolio is now looking a lot healthier.

Both of these stocks are now just below my entry price, but there is still a lot of upside potential in both instances because they are still massively undervalued based on their low P/E ratios.

I have a minimum long-term target price of $200 for Apple based on forward earnings estimates and I am still confident that BATS will hit 3000p at some point this year, which is about 15% higher than it is today.

I have one other tobacco holding – Philip Morris (PM) – and this too has recovered strongly, but I will probably look to get out at break-even in this case because my entry price was far too high in hindsight.

The good thing about PM is that it pays a decent dividend every 3 months, just like BATS, so I have no problem waiting for the price to recover, and I may just decide to hold on to it for a few years even if it gets back to $80.

My biggest holding is GVC, which is establishing itself as one of the biggest gaming companies in the world, but this has performed poorly this month.

Nevertheless this is very much a long-term holding and I am still holding out for a minimum price target of 800p, which should hopefully be taken out some time this year because it is still trading on a low P/E ratio and has a high dividend yield at its current price of 662p.

My only other holding is my FTSE 100 tracker (ISF.L), which is now up 1.52% overall, but I don’t really pay too much attention to the price of this ETF because this is a long-term holding that I intend to keep for many years because of its lucrative quarterly dividends and its long-term growth potential.

Short-Term Trades

As well as holding stocks for medium and long-term gains, plus of course the dividends, I also like to trade stocks on a short-term basis whenever I see some good opportunities, and in that respect, January has been a very profitable month.

I opened long positions on Aviva (AV.L), GVC (GVC.L) and IG Group (IGG.L), and managed to bank some decent profits from each of these stocks.

Outlook – Dividends Coming Soon

Although I am waiting for the markets to have some kind of pull-back in the coming weeks, I am very confident about the coming months because the ex-dividend date is rapidly approaching for all of the stocks and ETFs in my portfolio, and because eToro pays dividends on this ex-dividend date, these funds will soon be added to my account ready to be reinvested.

I also have a decent amount of cash sitting on the sidelines ready to be reinvested should the markets fall in the meantime, so I feel that I am in quite a strong position.

Follow Me on eToro

If you would like to follow my journey on eToro, simply go to the eToro website and search for SteadyProfits to view my live trading results and to see my latest trades.

You might also like to read my review of eToro to learn more about how this social trading platform works, if you haven’t already done so.

Past performance is not an indication of future results. This content is for information and educational purposes only and should not be considered investment advice nor portfolio management. 81% of retail investor accounts lose money when trading CFDs with this provider.

Filed Under: News Tagged With: etoro, steadyprofits

Average Daily Trading Range of the Major Forex Pairs in 2019

January 30, 2019 by James Woolley 2 Comments

If you are day trading the forex markets, it is important that you trade those currency pairs that have tight spreads first of all, but it is also a good idea to trade the more volatile pairs that have large average trading ranges every day because this will make it a lot easier to generate consistent profits.

Similarly, if you are considering trading other markets on a short-term basis, you also need to look at how many points they tend to move on average per day, in order to weigh up whether or not they are worth trading.

So just as I did last year, I thought it might be useful to once again list the average daily trading range of all the major currency pairs, as well as all of the most popular indices, commodities and cryptocurrencies (as of 30 January 2019):

AUD/NZD – 52
AUD/USD – 53
EUR/CHF – 43
EUR/GBP – 64
EUR/JPY – 77
EUR/USD – 56
GBP/JPY – 131
GBP/USD – 101
USD/CAD – 62
USD/CHF – 46
USD/JPY – 56

FTSE 100 – 82
DOW JONES – 322
S&P 500 – 33
NASDAQ – 107

BRENT CRUDE – 164
US CRUDE – 153
GOLD – 9

BITCOIN – 137
BITCOIN CASH – 10
ETHEREUM – 7
RIPPLE – 2
LITECOIN – 2

(all figures quoted have been rounded up or down to the nearest whole number)

Starting with the main forex pairs, it is clear that the GBP/JPY and GBP/USD pairs both look particularly appealing to short-term traders right now because they both have an average daily trading range of over 100 pips.

However much of this volatility is due to the ongoing uncertainty surrounding Brexit, so day traders need to be wary of any breaking news when trading these or any other GBP pairs.

Apart from these pairs, many of the major currency pairs have an average trading range of around 50-70 pips, which is more than enough to be able to trade, providing that the spreads are around 2-3 pips at the most, but it is worth noting that nearly all of them have seen their average trading range go down a little in recent weeks, including the EUR/USD pair, as you can see in the chart below:

ATR of EURUSD Pair - January 2019

It could be argued that the indices are the main markets that day traders should consider trading right now because these have very large average daily trading ranges at the moment.

The Dow Jones typically moves 322 points per day and the NASDAQ typically moves over 100 points per day, while even the FTSE 100 tends to move 82 points per day, which is a lot higher than it is usually.

With regards to the oil markets, these have always been very popular markets to trade for day traders, and with an average range of over 150 points for both Brent and US Crude, they are still very tradable right now.

Finally, it is worth noting that the major cryptos are still not really suitable for day trading because of the low volatility of these instruments and the large spreads.

Even though Bitcoin has a daily trading range of 137 points, a typical spread of 30-50 makes it almost impossible to make consistent short-term profits, and it is a similar story with many of the other cryptos as well.

Anyway I hope you found this information useful. I will update this page with the latest average trading ranges throughout 2019 to give you an idea of which forex pairs and which markets are the most volatile, and therefore potentially the most profitable to trade at any given time.

If you are interested in day trading yourself, it is important to use a broker that has tight spreads and fast execution, and FXTM satisfies both of these criteria, with spreads starting from 0.1 points on ECN accounts and 0.5 points on Standard accounts.

Latest Trading Ranges in May 2019

It is always interesting to see how the markets have evolved, and which instruments seem to be the most volatile (and therefore potentially the best ones for trading) at any given time.

So with that in mind, here are the latest trading ranges for all of the currency pairs, stock markets, commodities and cryptocurrencies listed above, along with the previous trading ranges from January (shown in brackets):

AUD/NZD – 46 (52)
AUD/USD – 44 (53)
EUR/CHF – 38 (43)
EUR/GBP – 41 (64)
EUR/JPY – 60 (77)
EUR/USD – 45 (56)
GBP/JPY – 88 (131)
GBP/USD – 75 (101)
USD/CAD – 60 (62)
USD/CHF – 38 (46)
USD/JPY – 44 (56)

FTSE 100 – 61 (82)
DOW JONES – 246 (322)
S&P 500 – 26 (33)
NASDAQ – 91 (107)

BRENT CRUDE – 135 (164)
US CRUDE – 131 (153)
GOLD – 9 (9)

BITCOIN – 209 (137)
BITCOIN CASH – 22 (10)
ETHEREUM – 9 (7)
RIPPLE – 1 (2)
LITECOIN – 5 (2)

Starting with the major currencies, it is immediately obvious by comparing the latest average trading ranges with those from January that the forex markets have generally become a lot less volatile.

Every single currency pair is trading within a smaller range on a daily basis, and it is noticeable that the GBP pairs in particular are significantly less volatile than they were before. This is probably due to a stalemate in the whole Brexit affair and a long and lengthy delay that is pretty much guaranteed.

It is not just the forex pairs that have become less volatile. The world’s major stock markets are trading within smaller ranges on a daily basis, as indeed are the oil markets. The only exception is gold, which is still moving around 9 points per day, as it was before.

The most interesting finding from these latest figures is that the major cryptocurrencies appear to have become a lot more volatile than before. However when you consider that many of them have risen sharply in recent months, they are probably about the same in relative terms.

So I wouldn’t necessarily start assuming that cryptos are the top trading instruments for day traders right now. Even though many of the markets are trading in smaller ranges as we approach summer, these will always be some of the best markets to trade because they have much tighter spreads. They are just a little harder to trade at this time of the year.

Update for September 2019

The quiet summer period is now coming to an end, although with the ongoing uncertainty surrounding Brexit, it is fair to say that the major forex pairs, particularly the British pound pairs, haven’t been as quiet and as so-moving as they have been in previous summers.

Before I discuss this any further, let me give you the updated average daily trading ranges for all of the major indices, currency pairs, commodities and cryptocurrencies (previous trading ranges from May are shown in brackets):

AUD/NZD – 49 (46)
AUD/USD – 42 (44)
EUR/CHF – 47 (38)
EUR/GBP – 69 (41)
EUR/JPY – 78 (60)
EUR/USD – 50 (45)
GBP/JPY – 136 (88)
GBP/USD – 99 (75)
USD/CAD – 61 (60)
USD/CHF – 57 (38)
USD/JPY – 67 (44)

FTSE 100 – 93 (61)
DOW JONES – 380 (246)
S&P 500 – 43 (26)
NASDAQ – 137 (91)

BRENT CRUDE – 151 (135)
US CRUDE – 159 (131)
GOLD – 21 (9)

BITCOIN – 503 (209)
BITCOIN CASH – 17 (22)
ETHEREUM – 10 (9)
RIPPLE – 2 (1)
LITECOIN – 5 (5)

Apart from the very volatile Bitcoin, which now trades within a range of over 500 points per day on average, the cryptocurrencies haven’t really increased or decreased in volatility since the last update back in May.

However you can see that many of the other markets have actually become a lot more volatile thanks to a combination of Brexit, Donald Trump, ongoing trade wars and the threat of a possible recession.

Both Brent crude oil and US crude have seen slightly higher average trading ranges towards the end of summer, while gold’s average trading range has more than doubled as a result of people moving some of their capital into this traditional safe haven.

The indices have also become a lot more volatile as a result of some fairly wild swings and a lot of uncertainty in the markets right now.

Finally, as mentioned earlier, many of the major currency pairs have also seen their average daily trading ranges go up in recent weeks and months. This is true of the dollar and euro pairs, but it is the pound pairs that have been experiencing some large daily price moves, and that is only likely to continue as the Brexit deadline draws ever closer.

Update for 2023

If you would like to see how the markets have changed over the years since this post was first published, and whether they have each become more or less volatile, I have published a post that shows the average trading ranges of all of the main markets in 2023.

Filed Under: Analysis Tagged With: atr, average true range, daily trading range

AUD/NZD Still in a Very Strong Downward Trend in January 2019

January 28, 2019 by James Woolley Leave a Comment

Introduction

A lot of traders tend to focus on the British pound, the US dollar and the Japanese yen when trading the currency markets, but there are a few other pairs that have relatively low spreads, and are potentially very profitable to trade.

One such pair that often goes unnoticed by traders is the AUD/NZD pair, but it has been interesting to watch the price action of this particular pair in recent times because the New Zealand dollar continues to strengthen against the Australian dollar over time, and is not really showing any signs of reversing this trend.

Strong Downward Trend

One way of determining the current price trend is to add the 20, 50, 100 and 200-period exponential moving averages to your daily price chart, and see where the price trades in relation to these moving averages.

If the price is above all four of these moving averages, then it is in a strong upward trend, and if it is trading below all four of these moving averages, it is obviously in a strong downward trend.

Furthermore, if the price is also trading above or below these moving averages on multiple time frames, such as the weekly and monthly charts, for example, then you know that it is in an established long-term trend right now.

That’s precisely the case with the AUD/NZD pair because as you can see from the chart below, the price is trading below the 20, 50, 100 and 200-period exponential moving average on the monthly, weekly, daily and 4-hour charts:

AUDNZD Strong Downward Trend - January 2019

Trading Opportunity

The question is; how you can actually capitalize on this long-term trend?

Well with such a strong trend in place, you might think that you can make money just by selling into any strength, and in many cases this may well be profitable.

However I would probably look for opportunities to go short on the daily time frame, and particularly around the 100 and 200-day moving averages because this is where the price is likely to run into some strong resistance.

Therefore any time there is a pin bar around these levels or divergence on one or more indicators, for instance, this would probably be a good time to take a short position.

Filed Under: Analysis Tagged With: audnzd

  • « Previous Page
  • 1
  • …
  • 13
  • 14
  • 15
  • 16
  • 17
  • …
  • 29
  • Next Page »

Forex Rebates:

Choose from 40+ different forex brokers and crypto exchanges, and get cashback every time you trade:


Copy Profitable Traders:

If you join ZuluTrade, you can follow and subscribe to profitable traders and all of their trades will be automatically copied in your own trading account.

You can also earn money as a signal provider if you are already a profitable trader.

Click here to find out more

Recommended Broker:

Recent Blog Posts:

  • High Probability Trade on S&P 500 – 26 January 2024
  • Oanda Moves Into Prop Trading With Labs Trader Program
  • My eToro Performance in 2023 – Up 33.24%
  • The5ers Offering $20K Bootcamp Challenge For Just $1
  • Example of VWAP Bounce Trade on S&P 500 – 18 December 2023

Recent Articles:

VWAP Indicator
  • MA Sabres (LuxAlgo) Indicator
  • 10 Harsh Truths About Forex Trading
  • Best Websites for Monitoring Currency Strengths
  • Xmaster Formula Indicator for MT4 and MT5
  • Tools:

    Currency Heat Map

    Categories

    • Analysis
    • News

    Archives

    • January 2024
    • December 2023
    • November 2023
    • October 2023
    • September 2023
    • August 2023
    • July 2023
    • June 2023
    • May 2023
    • August 2020
    • June 2020
    • May 2020
    • April 2020
    • January 2020
    • December 2019
    • November 2019
    • October 2019
    • September 2019
    • August 2019
    • July 2019
    • June 2019
    • May 2019
    • April 2019
    • March 2019
    • February 2019
    • January 2019
    • December 2018
    • November 2018
    • October 2018
    • September 2018
    • August 2018
    • July 2018
    • June 2018
    • May 2018
    • March 2016
    • December 2015
    • November 2015
    • October 2015
    • August 2015
    • July 2015

    Disclaimer

    This website should be used for general information purposes only and in no way represents professional financial advice.

    Forex and CFD trading carries a high level of risk and it is possible to lose more than your initial deposit if using leveraged products.

    Copyright © 2026 · eleven40 Pro Theme on Genesis Framework · WordPress · Log in

    • About
    • Contact
    • Disclosure
    • Privacy Policy
    • Terms Of Service
    We use cookies to ensure that we give you the best experience on our website. If you continue to use this site we will assume that you are happy with it.OK