The Forex Chronicles

  • Rebates
  • Brokers
  • News
  • Analysis
  • Signals
    • Best Copy / Social Trading Platforms
    • eToro Review
    • FXTM Invest Review
    • Marketclub Review
    • ZuluTrade Review
  • Indicators
  • Strategies
  • Articles

US Crude Oil Update – 1 January 2019

January 1, 2019 by James Woolley Leave a Comment

Previous Breakout

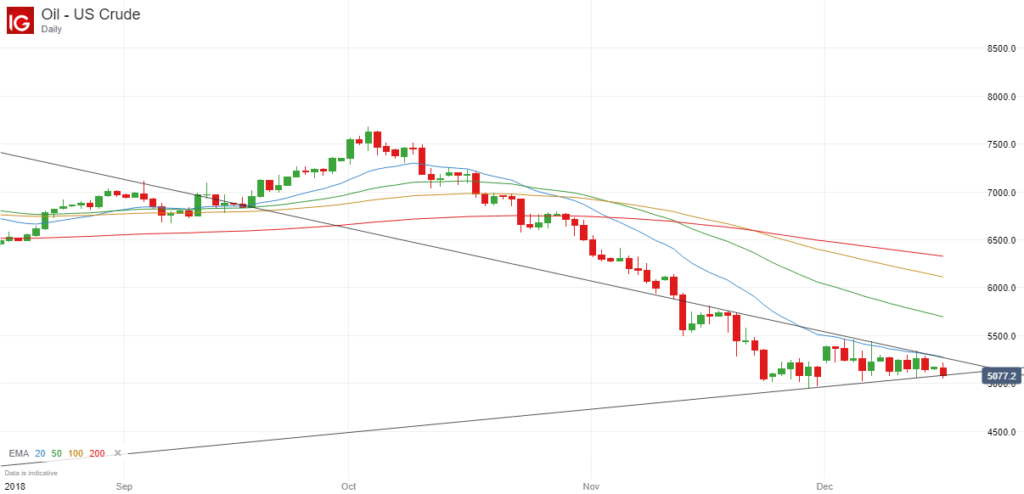
A few weeks ago I highlighted a possible breakout that was shaping up on the daily chart of US crude oil, and as it turned out, this would have been a very profitable trade:

US Crude Oil Breakout - December 2018

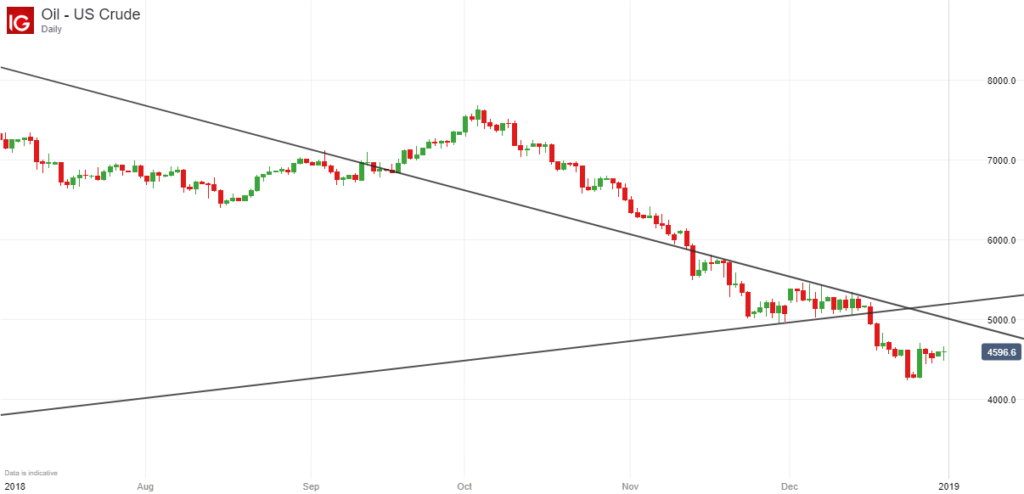
After breaking out of the previous trading range and closing below the lower trendline, the price went from around $49.50 to as low as $42.44 in a relatively short period of time.

Inside Bars

Since then, the price has recovered somewhat and is now trading around the $45 – $46 level, having moved relatively little during this quiet Christmas and New Year period.

However it is interesting to note that an inside bar formation has formed on this same daily chart, which suggests that there may be a possible breakout in the next few days.

US Crude Oil Inside Bars - 1 January 2019

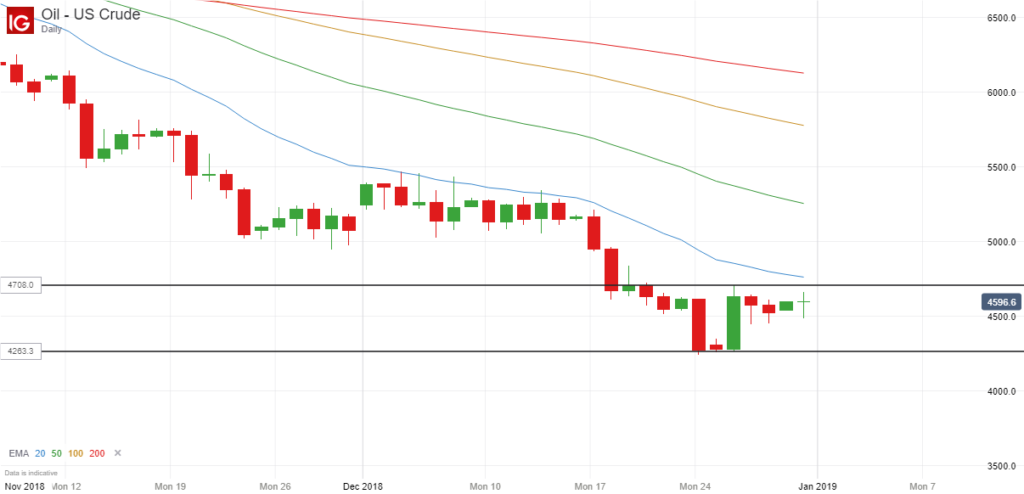
What I am basically saying is that after the large bullish candle on 26 December 2018, there have been 3 consecutive inside bars / candles (4 if you include the Sunday session) that have all traded within the range of this particular candle.

Trading Opportunity

This is often a very good set-up if you are looking to trade breakouts because traders will often spot the same breakout themselves and pile into a position once the price closes above or below the initial set-up candle, helping it to become a self-fulfilling breakout for everyone.

In this case, an upward breakout is looking more likely simply because it is trading closer to the high of the initial candle, and we are long overdue a bounce as the price of oil dropped so much last year.

Therefore if the price closes above $47.08 in the coming days without closing too far above this level, this could be a good opportunity to open a long position.

$50 would be an obvious resistance level, so it might be a good idea to target an exit price just below $50, but if it could break through this level, then the price could potentially surge towards the 100 and 200-day EMAs, which are currently at $57.76 and $61.26 respectively.

I personally think the first outcome is more likely because I think it will struggle to break through the $50 at the current time.

If the price doesn’t close above the high of the initial candle and instead breaks below the low of this candle, and indeed the low of the previous candle a few days earlier, then this will really open up the downside.

This would see the price drop to around $42, and if it closed around this level, you could then expect the price to fall below $40 fairly easily.

However at the moment we just have to wait and see what happens. What I will say is that the longer the price trades within the range of the initial set-up candle, the stronger the breakout is likely to be.

As always, please note that these are just my own thoughts and opinions. This doesn’t represent professional trading or financial advice in any way.

Filed Under: Analysis Tagged With: breakout, oil, us crude

eToro Trading Update – 30 December 2018

December 30, 2018 by James Woolley Leave a Comment

Bad Timing

Joining eToro and opening a live trading account (SteadyProfits) in the middle of November 2018 was not the smartest move I could have made in hindsight.

In fact with the stock markets falling so sharply in such a short space of time, it was probably the worst possible time to open an account because it has been practically impossible to make any money from stock trading during this time.

Yes I could have opened some short positions, but I generally avoid opening short positions unless I am hedging an open position, and to be honest, I really didn’t think the stock markets would fall as much as they have done.

Trading Performance

It is normal to get some kind of Santa rally just before Christmas, but that failed to materialise this year with all the negative sentiment that surrounds the global economies at the moment.

However the markets have rallied after Christmas, and thankfully my portfolio is now looking a little healthier. Indeed, I have also received a few dividends this month, which has also helped boost my account a little bit.

Nevertheless, my account is still down quite a lot, and it was not the start I was looking for because these early stats are not going to attract any followers or copiers at all.

According to eToro, I am currently down 8.32% overall, as you can see below, but this isn’t strictly true.

eToro SteadyProfits Performance - December 2018

I actually made the mistake of depositing a large amount of capital when my account was up a few weeks ago, and this had the effect of negatively distorting my stats.

The chart of my performance shows the real story, and as you can see below, a theoretical starting account of $10,000 is now worth $9,535.93, which represents a running loss of just over 4.46%:

This is still not very good, but with the markets crashing so hard, I am not too dissatisfied with this performance as we head into 2019.

Current Portfolio

At the moment I hold a mixture of UK and US stocks. My core holdings are GVC (GVC.L) and Apple (AAPL), which I am very confident about.

Both are currently in negative territory, but in the long run, I have a target price of $200 for Apple and a minimum target price of 800p for GVC, although looking several years ahead, the price could easily reach £15 – £20 in my opinion if their partnership with MGM starts to generate some decent profits from the highly lucrative US market.

Apart of these two holdings, I have a decent investment in ISF.L, an ETF that tracks the FTSE 100, which should be a good long term investment at these levels, particularly as it pays a dividend of 1%+ every 3 months.

I also have two tobacco companies (BATS.L and PM), which have both fallen sharply in recent months, but they now have low P/E ratios and pay good dividends, so I am confident of making some good long term returns on both of these. However I am kicking myself for buying PM far too early. I definitely got my timing wrong on this one.

Finally, I am also invested in MDY, which tracks the mid-cap S&P companies. I also entered far too early here as well, but once again, this should be a decent long-term investment.

Risk Score

My risk score dropped to 4 just recently since I made a large deposit and started buying real stocks instead of taking leveraged positions. However it has since edged up to 5, possibly because I opened one leveraged position in the past week, which is still OK, but I will be looking to bring this back to 4 or less in the future.

Final Thoughts

Looking ahead, I am still confident that I will make some decent returns from my eToro trading account, and eventually start to attract some copiers in 2019.

My timing has been poor up until now, both in terms of when I opened an account and when I bought certain shares, but I will continue to invest in good quality high-dividend stocks, as well as undervalued ETFs and growth stocks, and will also continue to open a number of short-term trades when the right opportunities present themselves.

So I will finish by wishing you all a Happy New Year, and I hope that we can all make some decent profits in 2019 and beyond.

Follow Me on eToro

If you would like to follow my journey on eToro, simply go to the eToro website and search for SteadyProfits to view my live trading results and to see my latest trades.

Past performance is not an indication of future results. This content is for information and educational purposes only and should not be considered investment advice nor portfolio management. 81% of retail investor accounts lose money when trading CFDs with this provider.

Filed Under: News Tagged With: etoro, steadyprofits

Dow Jones Analysis – Positive Divergence Hints at Santa Rally

December 19, 2018 by James Woolley Leave a Comment

December Price Falls

December is usually quite a good month for stock market traders and investors, but this has apparently been the 2nd worst December on record.

The leading stock market indices have all fallen sharply and there are many reasons why. Brexit, interest rate rises, trade tariffs and the threat of a possible recession have all weighed heavily on the indexes this month.

As a result of this, many people have given up on the idea that there will be a Santa rally this year, but looking at the 4-hour chart of the Dow Jones, there is still hope:

Dow Jones Positive Divergence - December 2018

Positive Divergence

As you can see, the price has recently been posting new lows, but if you look at three of the leading technical indicators, you will notice that there has been positive divergence on each of these indicators.

In other words, as the price has posted new lows, the CCI, RSI and Stochastics indicators have all failed to post new lows, and have actually been trading higher, which suggests that the downward move is running out of momentum.

Future Price Move

This positive divergence suggests that the price is likely to move higher in the coming days, but it should always be emphasized that these are all just indicators. The price could easily turn lower and start a new downward wave.

However with just 4 trading sessions left before Christmas, my own view is that we will still see a Santa rally this year, which could then continue until the New Year, as it so often does.

Therefore a price of 24,000 would be my first target, which should easily be achieved if there is such a rally, and looking further ahead, I wouldn’t be surprised it the price went back to the EMA (100) on this time frame, which is currently around 24,500. This would result in a rise of around 3% from the current price level.

As always, these are just my own thoughts and predictions. This in no way represents professional trading or financial advice. You should always do your own research before entering any positions in the markets.

Filed Under: Analysis Tagged With: divergence, dow jones, santa rally

Possible Breakout on US Crude Oil – December 2018

December 17, 2018 by James Woolley Leave a Comment

Recent Price Action

The price of US crude oil has been trading in quite a narrow sideways trading range in recent times, and seems to have stabilized between $50 and $55 with no clear direction.

However if you draw some trendlines on the daily chart of this particular commodity, you can see that the range is getting smaller all the time, and therefore a breakout is becoming increasingly likely:

US Crude Oil Daily Chart - December 2018

Downward Breakout?

At the time of writing this article, the price has actually dipped below the lower trendline ever so slightly, hinting at a possible breakout, however it is still too early to call.

That’s because you really need to wait for the price to close decisively outside of an established trading range before trading breakouts.

So in this instance we will need to wait until the candle closes at the end of the trading session before seeing if this is an actual breakout or not.

I think it is fair to say that most traders are actually expecting the price of crude oil to bounce back rather than break lower because 89% of traders have long positions on eToro, and 87% of traders have long positions on IG Index, for example.

Therefore it will be interesting to see what happens in the coming hours and days.

Possible Price Targets

If the price does indeed break decisively below the lower trendline, then it could easily fall below $50 to around $48, and possibly as low as $45, although it is very hard to set any price targets with any real accuracy right now.

The fact that we are entering a quiet period of the year for the markets, ie Christmas and New Year, means that volumes are a lot lower, and as a result of this, price moves are harder to forecast because any price swings that occur can either be exaggerated or thwarted by low volumes.

I personally would be a lot more confident about trading an upward breakout because the price has already fallen quite substantially since the start of October. Therefore I would look for the price to close around the $53 level or higher before considering opening a long position, as so many traders are predicting.

However these are just my own thoughts and opinions. This in no way represents financial or trading advice of any kind.

I just thought I would alert you to a possible breakout that could be about to take place on US crude oil as we head into Christmas.

Filed Under: Analysis Tagged With: breakout, oil, us crude

eToro Trading Update – Time To Get Serious

December 13, 2018 by James Woolley Leave a Comment

New Funds

If you read my previous update, you will know that I have been trading CFDs with eToro so far (under the account SteadyProfits) due to my modest account size, which has led me to take a shorter term view that I would normally.

Well all that is about to change because I added some new funds to my trading account earlier today, and so I am now ready to take things a lot more seriously.

By having a larger account, I will now be able to meet the minimum trade size requirements when purchasing stocks, whether for short-term trades or longer term investments, and won’t need to use leveraged CFDs any more, which not only push up my risk score, but also incur small fees every day when they are held overnight.

I have still made some small profits from CFD trading so far, as I will discuss below, but to be honest, I don’t really feel comfortable using leveraged instruments to trade stocks and ETFs because of the fees, which may appear small, but soon add up if you are holding on to positions for weeks or even months at a time.

Recent Results

After a weak start at the end of last month, my trading account is up 6.19% in December, and is now up 1.18% overall at the time of writing, as you can see below:

SteadyProfits Profile Page - 13 December 2018

I’m fairly happy with this after the big market swings that have taken place since I started trading on eToro about one month ago.

At the moment I have no open positions having closed my remaining long positions yesterday, but I did manage to bank some decent profits since my last update by taking long positions on BP (BP.L), Barclays (BARC.L), Imperial Brands (IMT.L) and Lloyds (LLOY.L).

I would have made a lot more, but I got my timing wrong on GVC and ended up cutting my losses on this position, but I will be looking to get back in with an actual share purchase at some point because this stock is grossly undervalued.

Risk Score

As a result of trading CFDs, my risk score of 6 is far too high right now, and I think this will prevent me from being copied in the future, but hopefully this will come down when I stop using leverage.

Future Trades

It looks like the major stock markets are positioning themselves for a Santa rally because they have already risen nicely in the last few days.

Therefore there is a chance that I might not get the opportunity to buy into some of the stocks that are currently on my watchlist, such as British American Tobacco (BATS.L), Imperial Brands (IMT.L), Barclays (BARC.L), Lloyds (LLOY.L), GVC (GVC.L), BP (BP.L), Legal and General (LGEN.L) and Apple (AAPL), but some of them are close to my preferred entry point if there is another sell-off in the markets.

Follow Me on eToro

If you would like to follow my journey on eToro, simply go to the eToro website and search for SteadyProfits to view my live trading results and to see my latest trades.

Past performance is not an indication of future results. This content is for information and educational purposes only and should not be considered investment advice nor portfolio management. 81% of retail investor accounts lose money when trading CFDs with this provider.

Filed Under: News Tagged With: etoro, steadyprofits

  • « Previous Page
  • 1
  • …
  • 15
  • 16
  • 17
  • 18
  • 19
  • …
  • 29
  • Next Page »

Forex Rebates:

Choose from 40+ different forex brokers and crypto exchanges, and get cashback every time you trade:


Copy Profitable Traders:

If you join ZuluTrade, you can follow and subscribe to profitable traders and all of their trades will be automatically copied in your own trading account.

You can also earn money as a signal provider if you are already a profitable trader.

Click here to find out more

Recommended Broker:

Recent Blog Posts:

  • High Probability Trade on S&P 500 – 26 January 2024
  • Oanda Moves Into Prop Trading With Labs Trader Program
  • My eToro Performance in 2023 – Up 33.24%
  • The5ers Offering $20K Bootcamp Challenge For Just $1
  • Example of VWAP Bounce Trade on S&P 500 – 18 December 2023

Recent Articles:

VWAP Indicator
  • MA Sabres (LuxAlgo) Indicator
  • 10 Harsh Truths About Forex Trading
  • Best Websites for Monitoring Currency Strengths
  • Xmaster Formula Indicator for MT4 and MT5
  • Tools:

    Currency Heat Map

    Categories

    • Analysis
    • News

    Archives

    • January 2024
    • December 2023
    • November 2023
    • October 2023
    • September 2023
    • August 2023
    • July 2023
    • June 2023
    • May 2023
    • August 2020
    • June 2020
    • May 2020
    • April 2020
    • January 2020
    • December 2019
    • November 2019
    • October 2019
    • September 2019
    • August 2019
    • July 2019
    • June 2019
    • May 2019
    • April 2019
    • March 2019
    • February 2019
    • January 2019
    • December 2018
    • November 2018
    • October 2018
    • September 2018
    • August 2018
    • July 2018
    • June 2018
    • May 2018
    • March 2016
    • December 2015
    • November 2015
    • October 2015
    • August 2015
    • July 2015

    Disclaimer

    This website should be used for general information purposes only and in no way represents professional financial advice.

    Forex and CFD trading carries a high level of risk and it is possible to lose more than your initial deposit if using leveraged products.

    Copyright © 2026 · eleven40 Pro Theme on Genesis Framework · WordPress · Log in

    • About
    • Contact
    • Disclosure
    • Privacy Policy
    • Terms Of Service
    We use cookies to ensure that we give you the best experience on our website. If you continue to use this site we will assume that you are happy with it.OK