The Forex Chronicles

  • Rebates
  • Brokers
  • News
  • Analysis
  • Signals
    • Best Copy / Social Trading Platforms
    • eToro Review
    • FXTM Invest Review
    • Marketclub Review
    • ZuluTrade Review
  • Indicators
  • Strategies
  • Articles

Bearish Signals For US Stock Markets – October 2018

October 23, 2018 by James Woolley Leave a Comment

Previous Price Action

I think many traders were shocked by the severity of the mini-crash that occurred recently on the US stock markets because it seemed to come out of nowhere, even though many traders and investors have been expecting some kind of pull-back for quite a while now.

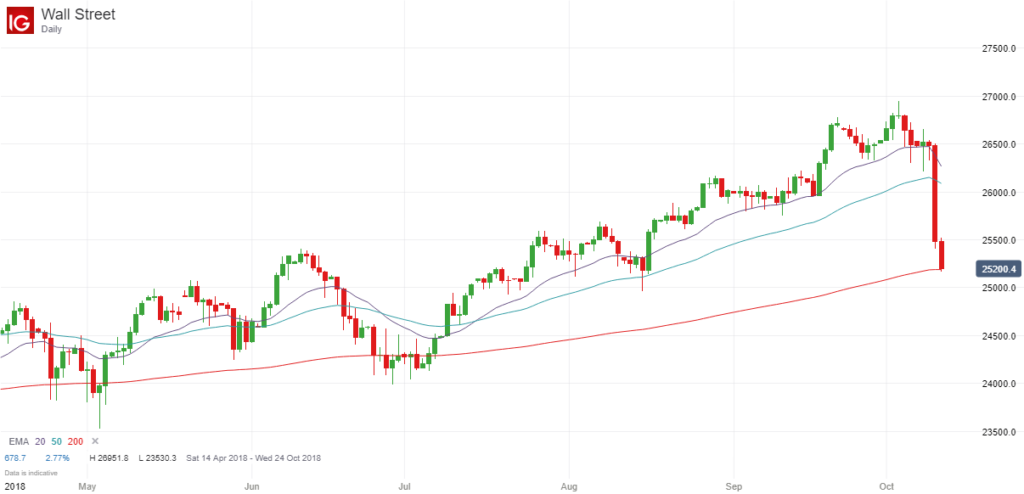
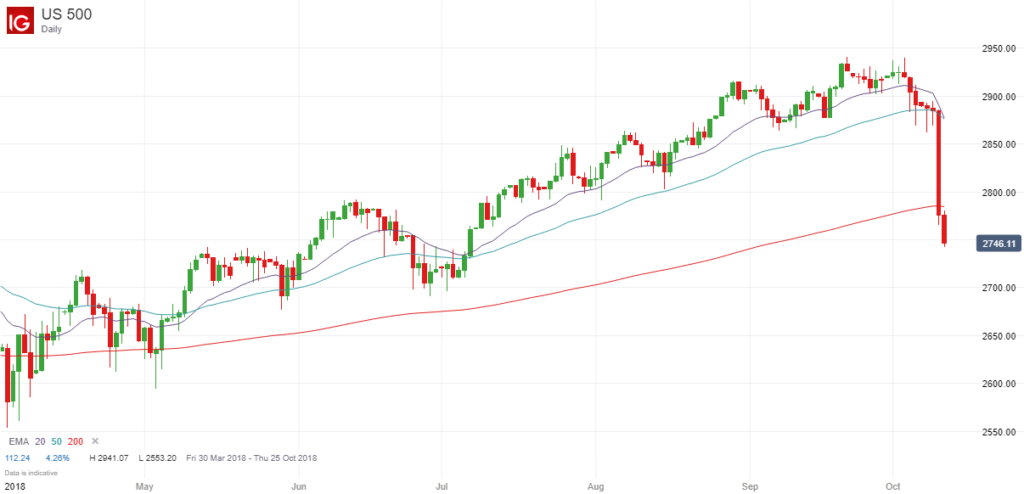
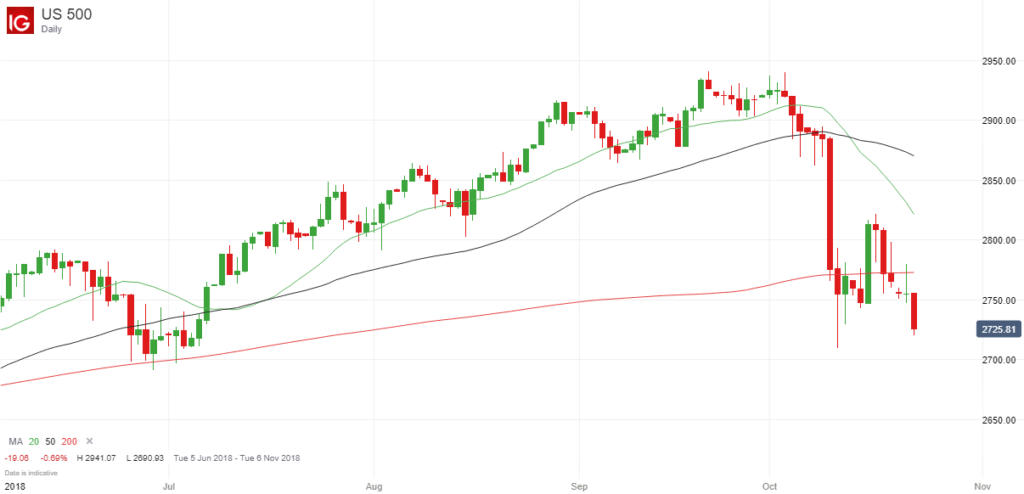
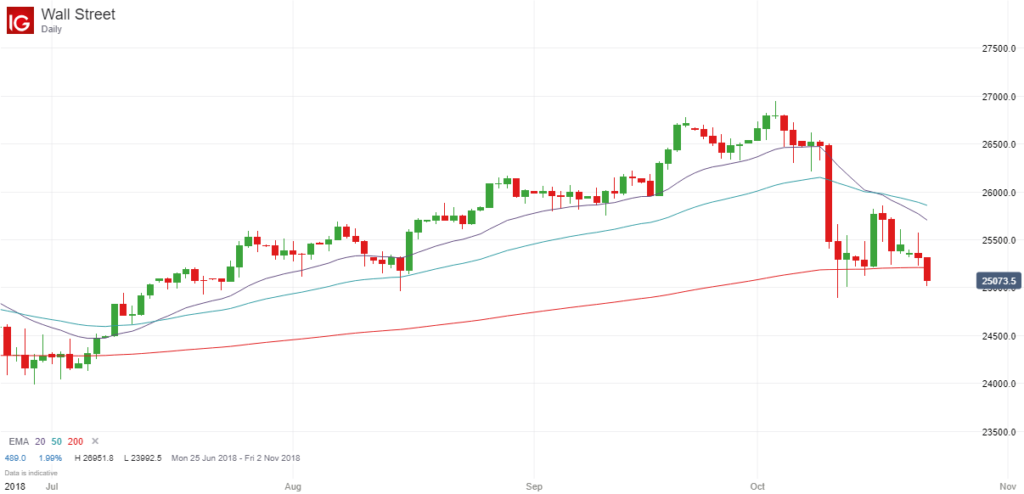
Since then there hasn’t really been a continuation of the sell-off because the price seems to have consolidated around the 200-day exponential moving average of both the S&P 500 and the Dow Jones.

However after a brief reversal, it is clear that there is not enough momentum to take it back to its previous highs, and worse still, the price action of the previous two trading sessions paints a bleak picture.

On both occasions the price traded a lot higher during the day, but ended up falling back and closing close to its opening price, which is a very bearish sign.

Furthermore, the futures prices of both of these markets are currently suggesting that the price is set to open a lot lower later today.

S&P 500 Price Weakness - October 2018

Dow Jones Price Weakness - October 2018

Future Direction

It is generally a bad idea to make predictions, particularly if you are backing your predictions with your own money, but the signs are not good if you are hoping for a recovery.

The two bearish pin bars and what is looking like a significantly lower opening later today is going to take the price further away from the EMA (200), and we have already seen the EMA (20) cross below the EMA (50), which is obviously another bearish signal.

I think the key thing to look for here is to see if the price can break below the previous lows on both the S&P 500 and the Dow Jones, which currently stand at 2709 and 24896 respectively.

If this happens, and the price actually closes below these lows, then there is a high probability that the price will go a lot lower.

Even if the price consolidates below the EMA (200) in the next few trading sessions, there is the potential for the dreaded death cross to occur, where the EMA (50) crosses below the EMA (200).

This would attract a lot of headlines in the financial media, and would almost become self-fulfulling because these negative headlines by themselves often encourage people to sell their shares and force the markets lower.

So while there is always the possibility of a consolidation or even a reversal, the markets are looking very weak right now, and if the price breaks below the recent lows, there could be a much bigger sell-off.

Filed Under: Analysis Tagged With: dow jones, s&p500

Why It Is Almost Impossible To Day Trade Bitcoin

October 19, 2018 by James Woolley Leave a Comment

Popularity of Bitcoin

Bitcoin ImageCryptocurrencies such as Ripple, Litecoin, Ethereum and Dash are continually being mentioned on the various different financial news channels and websites , but it is fair to say that Bitcoin is still the most well-known of these cryptocurrencies, and the most talked about.

Many people have chosen to actively buy some Bitcoin coins in the last five years or so and hold on to them as a long-term investment, but others now prefer to trade the price movements of Bitcoin over the course of several days or weeks via CFDs because they can open long positions and short positions.

However while it is true that many brokers now offer CFDs for Bitcoin and many of the other popular cryptocurrencies, it is worth pointing out that these markets are still not really suitable for day trading.

Here are some of the reasons why:

Low Average Daily Trading Range

There was a time at the end of 2017 and the beginning of 2018 when the price of Bitcoin used to fluctuate by around 1500-1900 points a day, but volatility has been steadily declining throughout 2018, and the average daily trading range is now just 208 points.

Therefore this makes it very difficult to make money from if you are just looking to hold on to a position for no more than a few hours, and don’t want to hold any overnight positions.

It is hard enough to predict where the price is heading in the next few weeks or months, but it is even harder trying to correctly predict the direction of the price on any given day.

Large Spreads

Following on from the last point, even if you were able to correctly predict the price direction of Bitcoin on a daily basis, the large spreads would massively eat into your profits.

As stated above, the average daily trading range is currently just over 200 points. So when you bear in mind that many of the leading CFD brokers have spreads of between 50 and 150 points, it is practically impossible to consistently make money from short-term day trades.

Easy Markets have spreads from 45 points on Bitcoin, which is very reasonable, but this still isn’t low enough to make Bitcoin a viable day trading instrument.

Large Margin Requirements

There is one other factor that restricts the ability for traders to day trade Bitcoin, and that’s the large margin requirements.

Many brokers require greater margin for cryptocurrencies than other markets because they are viewed as being a lot more risky, and this is particularly the case for Europe-based traders because the new ESMA rules require a margin of at least 50% when trading cryptos.

Final Thoughts

As you can see, there are many reasons why Bitcoin is not really suitable for day traders at the present time.

The large spreads and the large margin requirements, combined with the low average trading range make this virtually impossible to make money from right now.

Therefore if you are someone who is looking to trade Bitcoin, you should take a longer term view and be prepared to hold on to your positions for days, weeks or months at a time because then these factors will be less of an issue, even if you have to pay a small daily financing charge for holding long positions overnight.

If you open a long position and the price of Bitcoin goes up by $500 or $1000 one week later, then a $50 spread won’t eat into your profits too much, and the daily financing charges will be relatively small.

Over time the spreads may start to come down, and there is a possibility that the ESMA may lower their margin requirements for European traders. However until that happens, it is probably better to look for breakouts or price reversals, for example, and wait for the big price moves to occur, which are obviously more likely to occur over the course of several days rather than a few hours.

Filed Under: News Tagged With: bitcoin, cryptocurrencies, day trading

Possible Breakout on the EUR/JPY Pair – October 2018

October 17, 2018 by James Woolley Leave a Comment

Breakout Criteria

There are various factors that I will consider when looking for potential breakout trades, but one of my favorite patterns is when you get a combination of a moving average cluster and a sideways trading range.

In other words, I like to see the 20, 50, 100 and 200-period exponential moving averages all trading close together because this indicates a period of consolidation and indecision, and is often the pre-cursor to a big breakout.

Similarly, I like to see the price trading in a consistent trading range close to these moving averages because this makes it easier to detect a breakout, and gives you a natural entry point because you just enter a long position when the price closes above this range or a short position when the price closes below this range.

I have just found that both of these criteria are present on the daily chart of the EUR/JPY pair, so this could potentially develop into a good trading opportunity:

EURJPY Potential Breakout - October 2018

Trading Opportunity

What I like about this set-up is that the trading range is currently very narrow, which is always a good thing because you can potentially make more profits, and can make your stop losses smaller if you place them just outside this range.

The only real danger is that you sometimes get a few false breakouts before the big one, which could happen here, but there is still the potential for the price to move at least 200 points in either direction.

A breakout to the upside could see the price retest its highs from last month at around 133.00, with 132.00 as a first target and potentially a price to close half the position and move the stop loss up to break-even.

A breakout to the downside, meanwhile, would see 128.00 as the first target because this was a recent support level, and if the price breaks through this level, then 126.00 could easily be attained.

It should always be pointed out that breakouts are not always profitable because you sometimes get false moves, and I am not certainly not recommending any trades. These are just my own thoughts and opinions.

The key to success with any strategy is to keep your losing trades small, and let your winning trades run, and this applies to breakout strategies as well.

Filed Under: Analysis Tagged With: breakout, eurjpy

Gold Price Breakout – October 2018

October 15, 2018 by James Woolley Leave a Comment

Previous Price Action

The price of gold has been trading in a sideways trading range for the last few months, struggling to break decisively above or below the $1200 level.

This can be seen in the chart below because you can see that the price has been trending within the upper and lower trendlines for many weeks now.

Gold Breakout - October 2018

It seemed that there needed to be a catalyst to move the price strongly upwards or downwards to break out of this range, and last week’s stock market mini-crash provided this catalyst.

Safe Haven

In times of uncertainty, people often sell some of their stocks to preserve their capital and invest it into something a little safer and less risky, and gold is often seen as a perfect safe haven for this cash.

Therefore it was no surprise at all that the price of gold surged higher last week after the big sell-off because this happens fairly regularly.

As a result of this increased buying, the price of gold broke upwards out of this trading range, and is currently trading at $1232 at the time of writing.

Trading Opportunity

If you are someone who likes to trade price breakouts, you probably would have entered a long position at the close of the breakout candle, and would now be in profit slightly because the price has continued edging higher at the start of the London session.

Indeed the breakout candle closed at $1223, so this breakout trade is already $9 in profit at the time of writing.

I myself didn’t really like the look of this breakout because there was a very large breakout candle, and when this happens you will often get quite a large pull-back, and are then sitting on a loss, and sometimes the breakout quickly runs out of momentum.

Furthermore, I thought that there may be limited upside from here because the EMA (200) currently stands at $1245, which is likely to act as a strong resistance level.

There are some breakouts that look ripe for a trade, and others that are a little unconvincing, and I would say that this latest gold breakout is still a little unconvincing, which is why I will not be trading this breakout at any point, even after it broke higher today.

The reason why I say that is because we have already seen a slight recovery in the stock market, and there seems to be a little support right now that is holding the price of the major US markets up.

So if the markets do happen to bounce back this week, which could happen, this will likely have the opposite effect on gold, and the price may well fall back within in the previous trading range.

This has turned out to be a good breakout trade for those that had the courage to trade it, particularly if they have already moved their stop loss up to break-even because it is now a risk-free trade, but I never really felt that this was a high probability set-up.

I am prepared to wait for high probability set-ups where the odds of success are much higher. The price of gold could easily touch the EMA (200) and possibly break through it, but it’s no problem at all if this occurs. It’s just something you have to accept as a trader.

Filed Under: News Tagged With: breakout, gold

US Markets Crash – 200-Day Moving Averages Breached Already

October 11, 2018 by James Woolley Leave a Comment

Is the Bull Run Over?

There is no doubt that the US stock markets have had a fantastic run since they hit their lows back in 2008 and 2009 after the financial banking crisis.

The Dow Jones has gone from 6500 to around 27000 earlier this year, and the S&P 500 has posted similar gains, rising from around 670 to around 2940.

Indeed this has helped global stock markets soar higher in recent years, which has resulted in many active and passive investors growing their portfolios quite substantially.

However yesterday’s big sell off, triggered in part by the threat of rapidly rising interest rates, could signal that the bull run is finally over.

Yesterday’s Sell-Off

The fact is that many US companies had become seriously overvalued due to continued share price rises, and this was even more true for many of the top technology companies.

So my own personal view is that yesterday’s sell-off, which saw 800+ points wiped off the Dow Jones, has been a long time coming, and is actually quite healthy in many respects, even if it has negatively affected my own portfolio of UK stocks.

Now we just need to wait and see if this is a short-term correction or the start of a long-term correction, but using the 200-day moving averages as a guide, the future is looking ominous.

200-Day Moving Averages

The big price rises had seen the price of the major US stock indices continue to trade far higher than the 200-day moving average of these indices, but yesterday’s falls have already seen the price come back to trade close to this key support level in both instances.

Here is the daily chart of the Dow Jones…

Dow Jones Chart After October Sell-Off

….and here is the daily chart of the S&P 500…

S&P 500 Chart After October Sell-Off

As you can see, with the futures once again trading lower today, the price has actually dipped below the 200-day exponential moving average on the S&P 500 at the time of writing.

Future Price Direction

A fall below the 200-day moving average isn’t enough to signal the start of a new bear market, so it is still far too early to call.

However if the price continues to trade below this critical level for the next few weeks, the shorter-term EMA (50) will eventually cross below the EMA (200), triggering a death cross, and this would be a much stronger signal that we are seeing the start of a new bear market.

Therefore there is the potential for the Dow Jones to test the previous low of 2018 – 23112 – and for the S&P 500 to test the previous low of 2553 at the very least.

Whatever happens, these are interesting times whether you are a trader or investor, and it is going to be very interesting to see where the price of these major US indices go from here.

Filed Under: News Tagged With: dow jones, s&p500

  • « Previous Page
  • 1
  • …
  • 19
  • 20
  • 21
  • 22
  • 23
  • …
  • 29
  • Next Page »

Forex Rebates:

Choose from 40+ different forex brokers and crypto exchanges, and get cashback every time you trade:


Copy Profitable Traders:

If you join ZuluTrade, you can follow and subscribe to profitable traders and all of their trades will be automatically copied in your own trading account.

You can also earn money as a signal provider if you are already a profitable trader.

Click here to find out more

Recommended Broker:

Recent Blog Posts:

  • High Probability Trade on S&P 500 – 26 January 2024
  • Oanda Moves Into Prop Trading With Labs Trader Program
  • My eToro Performance in 2023 – Up 33.24%
  • The5ers Offering $20K Bootcamp Challenge For Just $1
  • Example of VWAP Bounce Trade on S&P 500 – 18 December 2023

Recent Articles:

VWAP Indicator
  • MA Sabres (LuxAlgo) Indicator
  • 10 Harsh Truths About Forex Trading
  • Best Websites for Monitoring Currency Strengths
  • Xmaster Formula Indicator for MT4 and MT5
  • Tools:

    Currency Heat Map

    Categories

    • Analysis
    • News

    Archives

    • January 2024
    • December 2023
    • November 2023
    • October 2023
    • September 2023
    • August 2023
    • July 2023
    • June 2023
    • May 2023
    • August 2020
    • June 2020
    • May 2020
    • April 2020
    • January 2020
    • December 2019
    • November 2019
    • October 2019
    • September 2019
    • August 2019
    • July 2019
    • June 2019
    • May 2019
    • April 2019
    • March 2019
    • February 2019
    • January 2019
    • December 2018
    • November 2018
    • October 2018
    • September 2018
    • August 2018
    • July 2018
    • June 2018
    • May 2018
    • March 2016
    • December 2015
    • November 2015
    • October 2015
    • August 2015
    • July 2015

    Disclaimer

    This website should be used for general information purposes only and in no way represents professional financial advice.

    Forex and CFD trading carries a high level of risk and it is possible to lose more than your initial deposit if using leveraged products.

    Copyright © 2026 · eleven40 Pro Theme on Genesis Framework · WordPress · Log in

    • About
    • Contact
    • Disclosure
    • Privacy Policy
    • Terms Of Service
    We use cookies to ensure that we give you the best experience on our website. If you continue to use this site we will assume that you are happy with it.OK