The Forex Chronicles

  • Rebates
  • Brokers
  • News
  • Analysis
  • Signals
    • Best Copy / Social Trading Platforms
    • eToro Review
    • FXTM Invest Review
    • Marketclub Review
    • ZuluTrade Review
  • Indicators
  • Strategies
  • Articles

Inside Bar Breakouts On GBP/JPY And Bitcoin From Last Month

September 5, 2018 by James Woolley Leave a Comment

Introduction

As I have mentioned previously on this site, inside bar breakouts are some of the my favorite trading patterns to trade because they will often yield some excellent profits.

This is particularly true when these inside bar breakouts come towards the end of a trend because they often provide solid confirmation that a reversal is taking place.

So with that in mind, I thought I would share you two profitable inside bar breakouts that occurred last month, ie August 2018, to give you an idea of how you can potentially trade these breakouts in the future.

Bitcoin Inside Bar Breakout

The first breakout is one that I have already discussed already in a previous blog post. On this occasion I actually discussed an inside bar breakout opportunity before it occurred, when I highlighted Bitcoin’s narrow trading range.

As you can see from the chart below, the price was trading sideways for long periods of time with no clear direction, with all the inside bar candles trading within the range of the initial bar.

Bitcoin Price Chart - August 2018

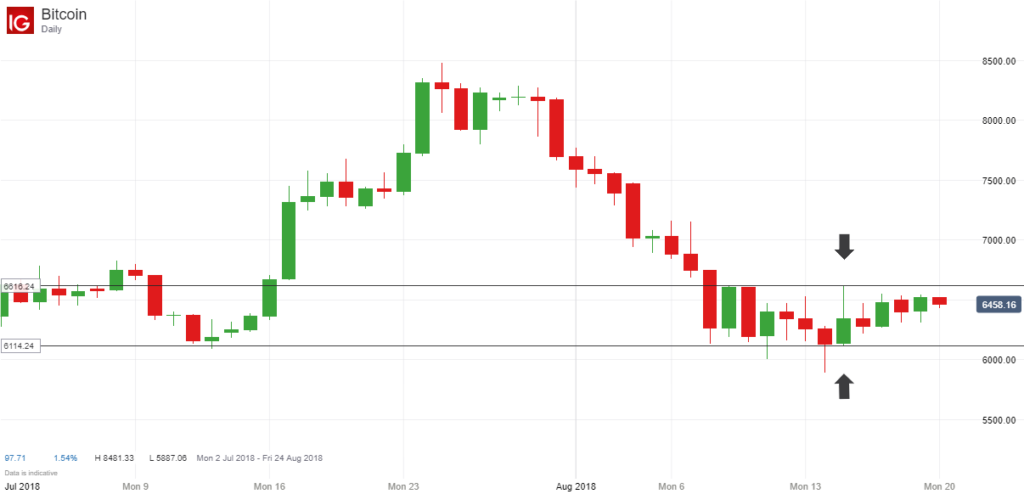
This is always a good set-up for a potential breakout, and this is what subsequently happened:

Bitcoin Inside Bar Breakout - August 2018

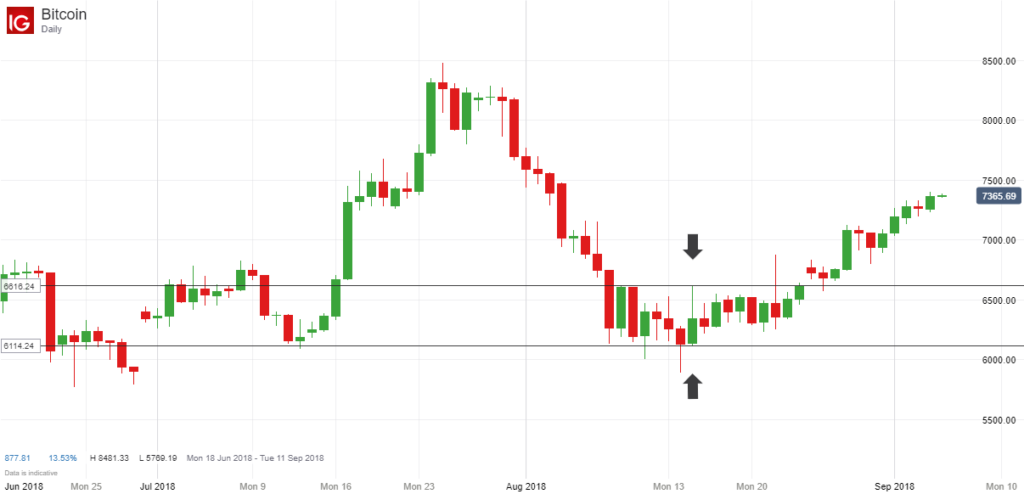
From a trading perspective, this wasn’t a perfect set-up because the breakout candle wasn’t exactly a decisive one. It is always a better signal when the price breaks strongly upwards or downwards out of its narrow trading range, but nevertheless this is one that would still have yielded decent profits of nearly 700 points so far if you had entered at the closing price of the first breakout candle.

GBP/JPY Inside Bar Breakout

Another decent set-up from last month occurred on the daily chart of the GBP/JPY pair. This pair had fallen sharply, along with many of the other GBP pairs, and during a period of consolidation, several inside bars had started to form.

Therefore when the price closed above the initial candle, this was a good opportunity to open a new long position and trade the breakout and the reversal.

GBPJPY Inside Bar Breakout - August 2018

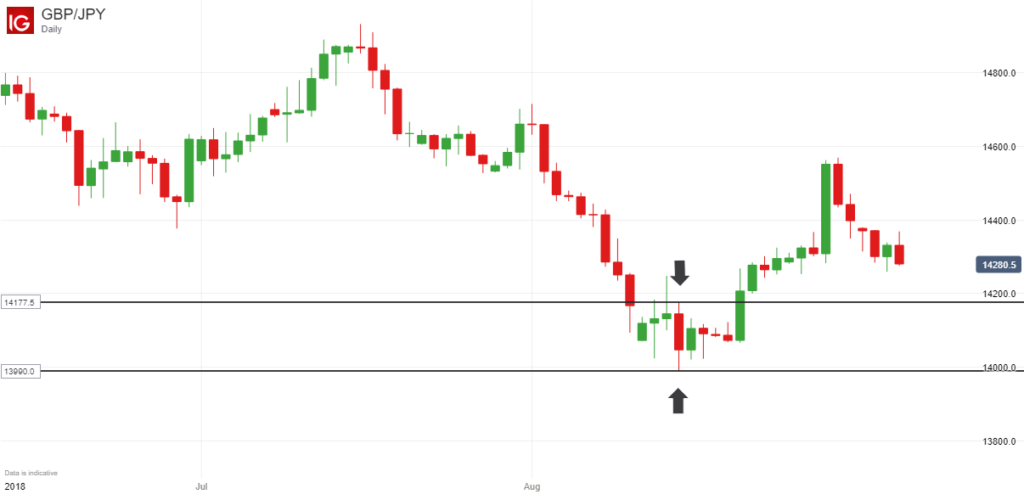
As you can see from the chart above, this had a much stronger breakout candle and would also have yielded some decent returns. With the momentum gathered from the positive Brexit news that was starting to emerge, the price moved around 250 points higher from the closing price of the breakout candle, and although it has since dropped back a little, it could still go higher.

Final Thoughts

It is worth mentioning that these inside bar breakouts don’t occur that often across all of the major currency pairs, but when they do occur, they can be very profitable when you get the right set-up.

I would also add that I would feel more confident trading a major currency pair, such as the GBP/JPY pair, for example, rather than a cryptocurrency such as Bitcoin simply because they are completely unregulated and have large spreads, and no-one really knows what could happen in the future. They could easily rise or fall thousands of dollars in a single day, and subsequently destroy your capital if you are not careful.

Filed Under: Analysis Tagged With: bitcoin, breakout, gbpjpy, inside bar

Possible Channel Breakout On EUR/GBP Pair For September 2018

September 1, 2018 by James Woolley Leave a Comment

Introduction

I have recently been discussing why the EUR/GBP is no longer an easy pair to trade, particularly from a day trading point of view.

I also highlighted the fact that this pair has been trading in quite a sideways trading range for a long period of time now, making it fairly difficult for long-term traders to trade as well.

All of the points raised in this article still hold true today, but that doesn’t mean that you still can’t make money trading this pair. There is still the potential to trade any breakouts when they occur, and to take advantage of any new trends that are emerging on the price chart of this pair.

Rising Channel

The EUR/GBP has indeed been trading in a sideways range if you look at the long-term price chart, but in recent months it has started to trend upwards and post new highs for 2018.

You will also notice that it has been trading within a rising channel if you draw some trendlines on the daily chart, and is now interesting to watch because the price is at a critical point at the moment.

EURGBP Rising Channel In 2018

After posting a yearly high of around 0.9099, the price of the EUR/GBP pair has dropped back nearly 150 points to just over 0.8950, thanks largely to positive news regarding Brexit boosting the British Pound, and is trading right at the bottom of this rising channel, even dipping below it at one point during yesterday’s trading session.

Trading Opportunities

I have to admit that the EUR/GBP isn’t the best pair to trade breakouts with because the resulting price movements can be quite small on occasions.

Nevertheless it might be worth watching to see if the price can close decisively below this channel for an opportunity to open a short position. It may also be worth waiting for a downward breakout followed by a retracement and then a secondary price move downwards for confirmation of a breakout, although you then run the risk of missing out altogether if there is no retracement at all, which can sometimes happen.

It all depends on where the price goes from here. This lower trendline may in fact act as support once again, and subsequently push the price back up to the upper trendline, making new highs in the process.

If it does so, there is strong resistance at the top of the trendline, and further resistance at 0.9300 if the price breaks through the upper trendline because this was the high of 2017, and is also a round number that has a lot of significance in the eyes of traders.

Filed Under: Analysis Tagged With: breakout, eurgbp, rising channel

EUR/USD Approaching Strong Resistance Level At 1.1700

August 27, 2018 by James Woolley Leave a Comment

Previous Price Breakout

I have posted a few trading updates about the EUR/USD pair just recently, and as you may recall, I pointed out that it was worth watching out for a possible breakout when the price was trading in a very narrow channel.

Well the price did in fact drop below this channel and although it did pull back a little, it did subsequently drop around 280 points from the closing price of the initial breakout candle.

Since then the price of the EUR/USD pair has rallied somewhat and is now back to where it was before this downwards breakout. So where does the price go from here?

Resistance at 1.1700

Well if we keep the same trendlines on the chart from last time, it is clear that there is strong resistance at these levels.

EURUSD Price Resistance At 1.1700

First of all, the upward and downward trendline from the previous channel act as resistance, but you will also notice that the EMA (100) is sitting just above this trendline at around 1.1700.

So when you also consider that these round numbers often act as strong support and resistance levels, it is clear that it is going to be hard for the price to break through this level in the coming days.

Trading Opportunities

At the time of writing, the price of the EUR/USD has reached a high of just over 1.1650 at the start of the overnight trading session (check out the last blog post to read about a trader who has managed to develop a highly profitable overnight trading strategy for the EUR/USD pair), but has subsequently dropped back to 1.1600. So it has already been sold off after approaching this resistance level.

Therefore if the price moves above 1.1650 towards the critical 1.1700 level once again, a short position might be a high probability trading opportunity that is worth taking because the price is unlikely to have the momentum to break through this level.

Alternatively, it might be worth watching just to see how the price reacts and then opening a position accordingly.

For example, if the price is sold off once again, you might want to think about opening a short position between 1.1600 and 1.1650, but if the price does actually break strongly upwards through the 1.1700 level, it might be worth opening a long position and trading a possible upward breakout because this is quite a strong level of resistance.

Disclaimer: These are just my own personal thoughts and doesn’t in any way represent financial advice. You should always do your own research and make your own decisions when trading forex.

Filed Under: Analysis Tagged With: eurusd, resistance

Night Trading Strategy On The EUR/USD Pair

August 23, 2018 by James Woolley 2 Comments

Profitable ZuluTrade Traders / Strategies

It has often been the case that many of the top signal providers on ZuluTrade (and other sites) tend to trade various different currency pairs, and will generally trade during the busiest times of the day, ie the London and New York sessions.

So it is quite surprising to discover that one of the most profitable signal providers is actually using a night trading strategy on the EUR/USD pair because this pair doesn’t usually move a great deal during the quiet overnight session.

Any strategy that is used during this session has to capture lots of small gains in the region of 5-10 pips because of the low volatility, but this particular strategy appears to do just that.

ThePipsMasterUK’s Strategy

Unfortunately it is hard to find out the exact strategy that this trader is using, but if you visit their trader profile page, you can read more about it.

You will see that this trader uses a number of different filters to find possible entry points, and will often open several positions in order to catch the trend.

Indeed they will actually open up to a maximum of 8 positions (0.1 lots per trade) at any one time, so this is something to bear in mind if you decide to copy the signals of this trader in your own account.

Most interesting of all is that this trader specifically trades the overnight session to avoid the volatility of the daytime sessions, and only ever trades the EUR/USD pair, which is good because it means that they have learned the behaviour of this pair and know exactly how it is likely to move during this session.

This certainly seems to be a profitable strategy because most of their trades tend to be closed out for a profit of between 5 and 8 pips, on average, and the losses are generally very small on the rare occasions that they do experience a losing trade.

Trading Results

At the time of writing (23 August 2018), ThePipsMasterUK is currently ranked as the 9th best trader on ZuluTrade, and has a total profit of 2429 pips since they started trading in March 2018.

They have had 395 winning trades out of 402, which equates to a remarkable 98% success rate, with an average profit of 6 pips, a best trade of 34 pips and a worst trade of -58 pips.

It should be pointed out that this trader appears to use a maximum stop loss of around 150 pips, so I would imagine that big losses could occur from time to time, but nevertheless I think it will be interesting to keep an eye on the performance of this particular trader, and to see if their night trading strategy on the EUR/USD pair continues to yield results.

Here is a widget that displays the very latest trading results of ThePipsMasterUK:

If you would like to automatically trade the signals of this trader in your own trading account, or would like to open a free demo account with ZuluTrade, you can do so by clicking on the Follow or Register buttons above.

However please note that I am not recommending that you copy the signals of ThePipsMasterUK or any other signal provider. This blog post is designed to be used for educational purposes only, and does not represent financial advice. You are solely responsible for any trading decisions that you make.

Final Thoughts

The main point I want to get across is that you don’t necessarily need to come up with a strategy that looks to capitalize on large price swings or high volatility.

By trading the overnight sessions, you can trade at a more relaxed pace with reduced volatility and no market-moving news announcements to worry about, and the long-term success of this particular trader suggests that it is definitely possible to be successful by coming up with a night strategy that trades the EUR/USD pair, or any other major pair that has tight spreads.

Filed Under: News Tagged With: eurusd, night trading, strategy, thepipsmasteruk

USD/CAD Symmetrical Triangle Chart Pattern For August 2018

August 21, 2018 by James Woolley Leave a Comment

Triangle Chart Patterns

It can be very useful to draw trendlines connecting the highs and the lows to see the underlying trend, and to spot any potential breakout opportunities that may be available.

Sometimes you will get ascending triangles and sometimes you will get descending triangles, but where there has been a sideways trading range, you will often see symmetrical triangles where the price is trading in an ever decreasing trading range / triangle.

This is beneficial for traders because the price has to eventually break upwards or downwards out of this triangle at some point, and when it does it often results in a strong breakout.

Symmetrical Triangle on USD/CAD Pair

You may be interested to know that there is a classic symmetrical triangle pattern on the daily chart of the USD/CAD pair right now.

USDCAD Symmetrical Triangle - August 2018

This pair has been in a slight upward trend since September 2017, but has been trading in quite a narrow sideways trading range this summer with little upward or downward momentum, which is why we now have this triangle pattern.

Potential Trade

As a result, it might be worth keeping a close eye on the daily price chart of the USD/CAD pair because it is getting very close to the lower trendline at the moment, and may be about to close below this trendline either today or in the coming days.

Therefore it could be a good time to open a new short position if the price does close strongly below this trendline because there could be a strong downward move in the following days and weeks.

As always, I am not recommending any trades. There is always the chance that any breakout could turn out to be a false one.

I am just sharing with you my thoughts and demonstrating how you can trade any breakouts that occur when the price breaks out of a symmetrical triangle pattern.

Filed Under: Analysis Tagged With: breakout, symmetrical triangle, usdcad

  • « Previous Page
  • 1
  • …
  • 23
  • 24
  • 25
  • 26
  • 27
  • …
  • 29
  • Next Page »

Forex Rebates:

Choose from 40+ different forex brokers and crypto exchanges, and get cashback every time you trade:


Copy Profitable Traders:

If you join ZuluTrade, you can follow and subscribe to profitable traders and all of their trades will be automatically copied in your own trading account.

You can also earn money as a signal provider if you are already a profitable trader.

Click here to find out more

Recommended Broker:

Recent Blog Posts:

  • High Probability Trade on S&P 500 – 26 January 2024
  • Oanda Moves Into Prop Trading With Labs Trader Program
  • My eToro Performance in 2023 – Up 33.24%
  • The5ers Offering $20K Bootcamp Challenge For Just $1
  • Example of VWAP Bounce Trade on S&P 500 – 18 December 2023

Recent Articles:

VWAP Indicator
  • MA Sabres (LuxAlgo) Indicator
  • 10 Harsh Truths About Forex Trading
  • Best Websites for Monitoring Currency Strengths
  • Xmaster Formula Indicator for MT4 and MT5
  • Tools:

    Currency Heat Map

    Categories

    • Analysis
    • News

    Archives

    • January 2024
    • December 2023
    • November 2023
    • October 2023
    • September 2023
    • August 2023
    • July 2023
    • June 2023
    • May 2023
    • August 2020
    • June 2020
    • May 2020
    • April 2020
    • January 2020
    • December 2019
    • November 2019
    • October 2019
    • September 2019
    • August 2019
    • July 2019
    • June 2019
    • May 2019
    • April 2019
    • March 2019
    • February 2019
    • January 2019
    • December 2018
    • November 2018
    • October 2018
    • September 2018
    • August 2018
    • July 2018
    • June 2018
    • May 2018
    • March 2016
    • December 2015
    • November 2015
    • October 2015
    • August 2015
    • July 2015

    Disclaimer

    This website should be used for general information purposes only and in no way represents professional financial advice.

    Forex and CFD trading carries a high level of risk and it is possible to lose more than your initial deposit if using leveraged products.

    Copyright © 2025 · eleven40 Pro Theme on Genesis Framework · WordPress · Log in

    • About
    • Contact
    • Disclosure
    • Privacy Policy
    • Terms Of Service