The Forex Chronicles

  • Rebates
  • Brokers
  • News
  • Analysis
  • Signals
    • Best Copy / Social Trading Platforms
    • eToro Review
    • FXTM Invest Review
    • Marketclub Review
    • ZuluTrade Review
  • Indicators
  • Strategies
  • Articles

Potential Inside Bar Breakout On Bitcoin For August 2018

August 20, 2018 by James Woolley Leave a Comment

Trading Bitcoin

After the European Securities and Markets Authority increased cryptocurrency margin rates to 50%, it has obviously become a lot more expensive to trade Bitcoin and other cryptocurrencies, and a lot less appealing.

The spreads can also be quite off-putting as well because even if your broker does offer Bitcoin trading, you may need the price to move 50-200 points (or more) just to break even.

Nevertheless those that do have enough capital in their trading accounts can still potentially benefit from some big price swings because this is still quite a volatile market to trade, and when the price does start moving, it can easily move upwards of 1000-2000 points in just a few days.

Inside Bar Breakout

Many people are sceptical about treating these cryptocurrencies the same as any other market, and using the same kind of technical analysis to find profitable trading opportunities, but based on previous price action, it does seem to be very profitable to trade any breakouts that occur.

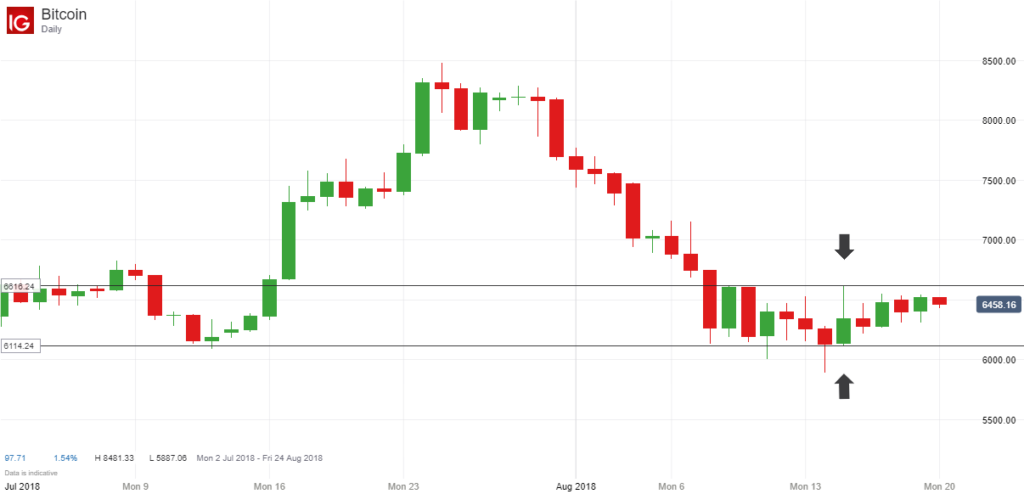
That’s why I wanted to highlight the current price action because the price of Bitcoin has been trading in a sideways range just recently, and more significantly, the last 5 daily candles are all inside bars, ie the last 5 candles are all within the high and low of the large candle from 15 August (indicated by the arrows), which had a daily range of around 500 points.

Bitcoin Price Chart 20 August 2018

How To Trade

A lot of traders have their own personal inside bar and breakout strategies that they like to use, but I myself like to enter a new position when the price moves above the high or below the low of the initial candle and CLOSES above or below this candle.

In my experience, you don’t want the breakout candle to be too large, but you don’t really want the breakout candle to be one that has a small trading range either because this could be a false breakout.

Anyway I just wanted to share my thoughts on the latest Bitcoin trading action, and explain how I like to trade these breakouts when they occur.

Whether the price moves strongly higher or strongly lower after the price closes above the initial candle remains to be seen, but it will be interesting to watch what happens regardless because the price has barely moved in the last few weeks.

An upward breakout could see the price test its recent highs of around $8500, whilst a downward breakout could potentially see the price collapse if it breaches its recent low of $5887 from last week and its previous low of $5769 from June.

Please note I am not offering any advice or recommending any trades. You should always do your own research and make your own decisions before entering a position.

Filed Under: Analysis Tagged With: bitcoin, breakout, inside bar

US Crude Oil Closes Below EMA (200)

August 16, 2018 by James Woolley Leave a Comment

Crude Oil Price Trend in 2018

If you have been following the price of US crude oil, you will have noticed that the price has been in a slight upward trend so far in 2018, going from around $60 per barrel at the start of the year to a peak of just over $74 per barrel at the start of July.

The price of Brent Crude has also been in a similar upward trend, rising from $67 to a peak of just over $80.

As a result of this, many of the large-cap oil stocks have seen their share price rise dramatically during this time.

Downward Trend in Summer

Since the price of crude oil peaked, it has since started to trend lower because we have seen a series of lower lows and lower highs.

This is relatively normal during the hot summer months because there is not the same demand, but from a trading perspective, it is interesting to look at the price chart to see if this is a temporary drawback, or the start of a more significant downward trend.

Price is Now Below EMA (200)

US Crude Oil Chart - August 2018

One key development is that the price of US Crude has just fallen below the 200-day exponential moving average (EMA (200)) on the long-term daily chart for the first time since September 2017, as shown in the chart above.

This is significant because this is a major indicator of the long-term trend, and is an indicator that is viewed with interest and acted upon by many traders.

So if the price continues to fall and establishes itself below this EMA (200) indicator, it could well be an opportunity to go short if there is a strong downward breakout.

Key Indicators of a Change in Trend

It is far too early to say for certain that US Crude is now in a bearish trend, and therefore likely to fall a lot further, just because it has closed below the EMA (200).

What we really need to see is a downward EMA crossover, where the EMA (20), EMA (50) and ultimately the EMA (100), all cross downwards through the EMA (200) because this will give a much stronger signal that a new bearish trend is emerging, and it is time to start looking for opportunities to open short positions.

It is also worth paying attention to the price of Brent Crude as well because if you look at this price chart, you will see that the price hasn’t yet closed below the EMA (200), but is very close to doing so.

Therefore if we do see downward EMA crossovers on both of these charts, this would suggest that the price of crude oil generally is entering a period of weakness, and is highly likely to continue falling.

Closing Comments

Even if we do see downward EMA crossovers, I still think it is highly unlikely that we will retest some of the previous lows of 2016, when the price of crude oil hit really did hit rock bottom, but I think a move towards $55 and possibly even $50 is certainly possible.

Either way, it will be interesting to see how the price reacts around these key levels because the EMA (200) is such a significant indicator in the world of trading.

We may find that this indicator acts as support and the price will eventually resume its upward trend, or at least stabilize between $65 and $70, but if we see further price falls, a big downward price move is definitely possible.

Filed Under: News Tagged With: brent crude, crude oil, oil, us crude

EUR/USD Trading Update For August 2018

August 14, 2018 by James Woolley Leave a Comment

Previous Analysis From Last Month

A few weeks ago I wrote this blog post discussing the low volatility of the EUR/USD pair, and showed how it was trading in an ever decreasing channel.

When you get a tightening trading range and low volatility with the exponential moving averages and bollinger bands all tightly packed together, you often get a strong breakout in one direction or the other when the price breaks out of this channel, and this is exactly what happened.

Downward Breakout During August

EURUSD August Breakout

At the start of this month, the price finally broke downwards out of this channel (and below the outer bollinger band), closing the day at 1.1586, which we highlighted at the time on our Twitter page and our new Instagram page.

The price then continued falling during the following three trading sessions, before bouncing back for a few days. However you will see that the previous trendline acted as resistance and traders used this resistance level to open new short positions and drive the price downwards again. So there was another opportunity to go short if you missed the initial breakout.

Subsequently, if you had opened a short position at the close of the initial breakout candle, you could have yielded over 200 points so far (if you had placed your stop loss above the trendline or above the high of the breakout candle, for example), and this downwards breakout could yet yield a lot more points.

Profitability of Channel Breakouts

Whether you took this particular trade or not, I just wanted to highlight how profitable these breakout trades can be if you are patient enough to wait until a clear breakout has occurred.

Yes it can be frustrating when one of your favorite pairs is trading in a narrow trading range because the short-term moves are hard to make money from, but if you switch your attention to the daily charts, you can see some large moves on occasions, and this is one example.

Filed Under: Analysis Tagged With: breakout, eurusd

79% of IG’s Retail Investors Lose Money With Spread Bets and CFDs

August 6, 2018 by James Woolley Leave a Comment

95% of Traders Lose Money – Fact or Fiction?

If you search online or read some of the forex trading forums, you will often hear people say that 95% of traders lose money, reconfirming the idea that it is very hard to make consistent profits from trading the financial markets.

This statistic was probably based on data from various different brokers originally, but the reality is that the percentage of profitable traders is possibly higher than 5%, as previously suggested.

IG’s New Disclaimer

Presumably as part of the the new ESMA rules and regulations, IG have revealed how many of their traders lose money trading spread bets and CFDs (contracts for difference).

In addition to pointing out the risks of trading spread bets and CFDs, they point out that:

“79% of retail investor accounts lose money when trading spread bets and CFDs with this provider.”

(correct at the time of writing – 6 Aug 2018)

IG.com Screenshot

My Own Thoughts

The first thing I would like to say is that I applaud IG for providing this information because it helps to provide complete transparency, and helps to build trust with both their existing customers and any prospective traders who are thinking about opening an account with them.

With regards to this 79% figure, I was actually very surprised because I have always believed that around 90-95% of traders lose money, based on my own previous experience and from reading industry statistics.

It is still difficult to know for sure because these figures may not be replicated across all brokers, and it may still be the case that only around 5% of traders make money on average across the entire industry.

However it should at least act as encouragement to know that 21% of traders with one particular spread betting and CFD provider are able to generate profits because this is quite a significant number.

UPDATE: IG and other brokers are now required to update this information in their disclaimer every 3 months, and so they now state that 81% of their traders lose money as of 12 February 2019. Nevertheless, this is still a lot less than the 95% figure that is so often quoted online. 

Filed Under: News Tagged With: cfds, ig, spread bets

EUR/USD Trading Update For July 2018

July 31, 2018 by James Woolley Leave a Comment

Lower Volatility in Summer

All of the major currency pairs tend to see a large reduction in volatility during the summer months, with smaller price moves every day, and the EUR/USD pair is no exception.

If you look at the average true range of this particular pair (using the ATR indicator), you will see that it has dropped to around 65 points right now at the end of July 2018, which makes it fairly hard to trade for any short-term traders.

Narrow Price Range

As well as having small price moves, it has also been trading in a narrow, sideways price range with no clear direction.

The 20, 50 and 100-day EMAs are all very close together and the Bollinger Bands are also very narrow, which helps to confirm this narrow trading range.

More importantly, if you draw two trendlines joining the highs and lows of the recent trading range, as shown in bold in the price chart below, you can see that the price is trading is an ever decreasing trading range, which is often the pre-cursor to a major breakout.

EURUSD 31 July 2018

Potential Trading Opportunity

Subsequently, this represents a possible trading opportunity because if the price breaks strongly upwards or downwards (and closes outside this range and outside the Bollinger Bands on the daily chart), this is potentially a good time to open a new position and capitalize from this breakout.

(Disclaimer: These are just my own thoughts and ideas, and it doesn’t represent financial advice in any way. Please do your own research before opening any positions.)

A Word of Warning

Trades like these are often very profitable because everything is in place for a strong breakout (narrow EMAs, narrow Bollinger Bands, trading within trendlines, etc), but you have to be careful during the summer months because volumes are lower and sometimes these breakouts don’t have the momentum to be sustained for very long.

It will be interesting to see what happens anyway because the price has to break out of this ever decreasing price range very soon, and so there could potentially be a big move upwards or downwards in the coming weeks if there is some momentum behind this breakout.

Filed Under: Analysis Tagged With: breakout, eurusd

  • « Previous Page
  • 1
  • …
  • 24
  • 25
  • 26
  • 27
  • 28
  • 29
  • Next Page »

Forex Rebates:

Choose from 40+ different forex brokers and crypto exchanges, and get cashback every time you trade:


Copy Profitable Traders:

If you join ZuluTrade, you can follow and subscribe to profitable traders and all of their trades will be automatically copied in your own trading account.

You can also earn money as a signal provider if you are already a profitable trader.

Click here to find out more

Recommended Broker:

Recent Blog Posts:

  • High Probability Trade on S&P 500 – 26 January 2024
  • Oanda Moves Into Prop Trading With Labs Trader Program
  • My eToro Performance in 2023 – Up 33.24%
  • The5ers Offering $20K Bootcamp Challenge For Just $1
  • Example of VWAP Bounce Trade on S&P 500 – 18 December 2023

Recent Articles:

VWAP Indicator
  • MA Sabres (LuxAlgo) Indicator
  • 10 Harsh Truths About Forex Trading
  • Best Websites for Monitoring Currency Strengths
  • Xmaster Formula Indicator for MT4 and MT5
  • Tools:

    Currency Heat Map

    Categories

    • Analysis
    • News

    Archives

    • January 2024
    • December 2023
    • November 2023
    • October 2023
    • September 2023
    • August 2023
    • July 2023
    • June 2023
    • May 2023
    • August 2020
    • June 2020
    • May 2020
    • April 2020
    • January 2020
    • December 2019
    • November 2019
    • October 2019
    • September 2019
    • August 2019
    • July 2019
    • June 2019
    • May 2019
    • April 2019
    • March 2019
    • February 2019
    • January 2019
    • December 2018
    • November 2018
    • October 2018
    • September 2018
    • August 2018
    • July 2018
    • June 2018
    • May 2018
    • March 2016
    • December 2015
    • November 2015
    • October 2015
    • August 2015
    • July 2015

    Disclaimer

    This website should be used for general information purposes only and in no way represents professional financial advice.

    Forex and CFD trading carries a high level of risk and it is possible to lose more than your initial deposit if using leveraged products.

    Copyright © 2025 · eleven40 Pro Theme on Genesis Framework · WordPress · Log in

    • About
    • Contact
    • Disclosure
    • Privacy Policy
    • Terms Of Service