The Forex Chronicles

  • Rebates
  • Brokers
  • News
  • Analysis
  • Signals
    • Best Copy / Social Trading Platforms
    • eToro Review
    • FXTM Invest Review
    • Marketclub Review
    • ZuluTrade Review
  • Indicators
  • Strategies
  • Articles

The Average Daily Trading Range of the Major Forex Pairs in 2020

June 15, 2020 by James Woolley Leave a Comment

Volatility in 2020

Every year I take a look at the average daily trading range of not only the various different currency pairs, but also a variety of other markets such as stock market indices, commodities and cryptocurrencies.

This is useful to know because it can tell you which markets currently have low volatility, and are therefore possibly worth avoiding from a trading perspective, and which markets are moving the most on a day to day basis and providing a lot more trading opportunities.

This information takes on greater significance in a year like this when we have had a major global pandemic wreaking havoc on the markets.

So as we are now nearly halfway through the year and starting to see economies return to some sort of normality, now is a great time to look at the ATR (average true range) of these markets (as of 15 June 2020) to see how they have each been affected:

AUD/NZD – 60
AUD/USD – 91
EUR/CHF – 57
EUR/GBP – 59
EUR/JPY – 99
EUR/USD – 78
GBP/JPY – 141
GBP/USD – 107
USD/CAD – 108
USD/CHF – 64
USD/JPY – 63

FTSE 100 – 143
DOW JONES – 635
S&P 500 – 67
NASDAQ – 210

BRENT CRUDE – 214
US CRUDE – 153
GOLD – 22

BITCOIN – 390
BITCOIN CASH – 11
ETHEREUM – 12
RIPPLE – 1
LITECOIN – 2

Currency Pairs

If we start with the currency pairs, it is not entirely clear just from these numbers, but volatility has slowly gone back to previous levels.

There was a big spike up in March and April for all of the major forex pairs as trading volumes surged and prices moved strongly in both directions as panic buying and selling hit the markets, but this volatility as since subsided as we enter the summer trading months, which are traditionally less volatile anyway.

Another surge in volatility cannot be ruled out, particularly if we see a second wave of infections and / or another series of lockdowns, but for now the major pairs are experiencing less daily movements than a few months ago.

The GBP/JPY is still one of the most popular pairs amongst traders with an average daily trading range of 141 pips, but the GBP/USD and USD/CAD are both good markets to day trade or swing trade with a daily movement in excess of 100 pips, and the EUR/JPY and AUD/USD are also fairly volatile right now as well.

Stock Market Indices

With regards to the major world markets, we have seen a much more pronounced upswing in volatility, which remains to this day.

The S&P 500 currently has a trading range of 67 points, which means that it is averaging a swing of more than 2% every day, while the Dow Jones has a staggering average trading range of 635 points, making it very popular with day traders.

Even the FTSE 100 is moving 143 points per day, whereas it would typically move a lot less than 100 points under normal market conditions.

So the indices are well worth considering for those short-term traders who want more movement or volatility than many of the forex pairs can offer.

(If we fast forward to 2023, we can see that 2020 was very much a golden year for day traders of stock market indices because as of June 2023, the S&P 500 was averaging 40 points per day (27 points less than 2020), while the Dow Jones, for example, now moves an average of 269 points compared to 635 points previously and the FTSE 100 index now moves an average of 58 points compared to 143 points in 2020).

Commodities

Many long-term investors turn to safe haven commodities when the market is dropping (or sell their existing gold holdings to invest into beaten up stocks). So it is no surprise that gold is now quite a high volatility market with an average range of 22 points.

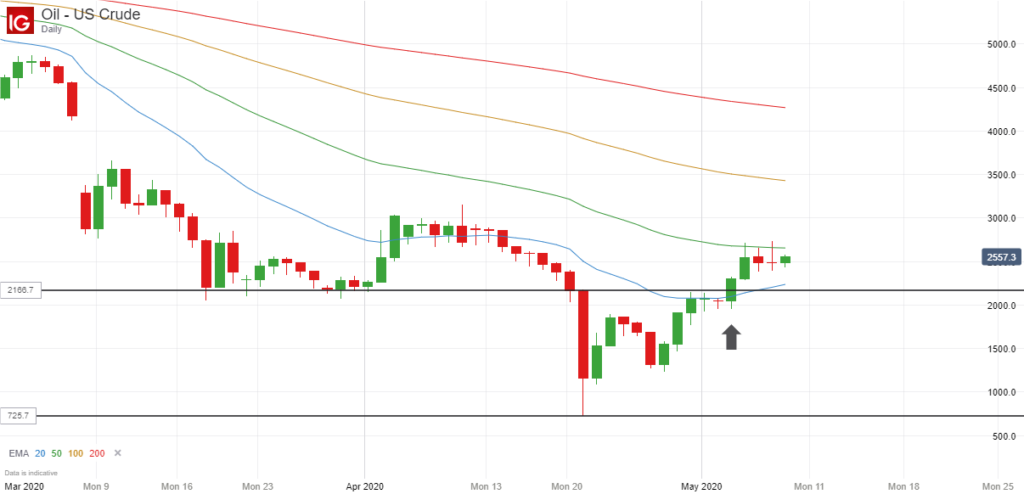
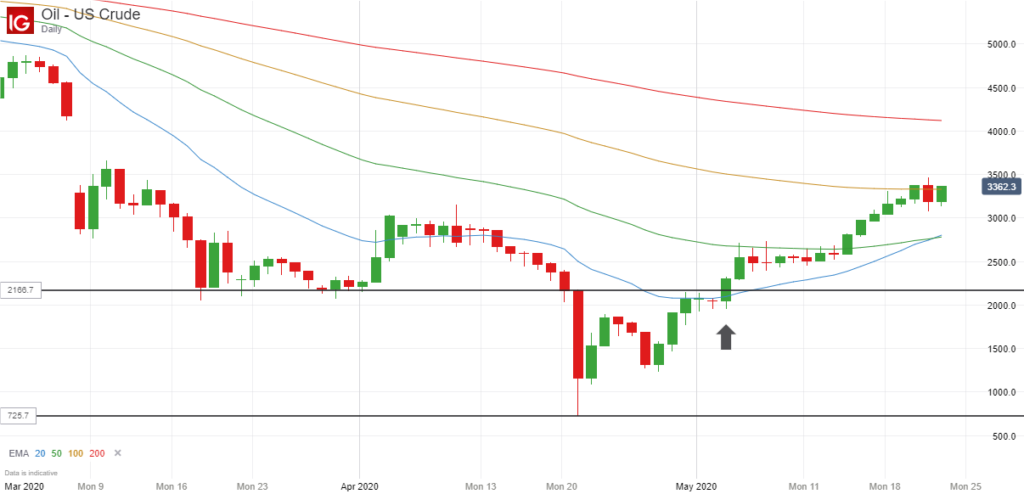
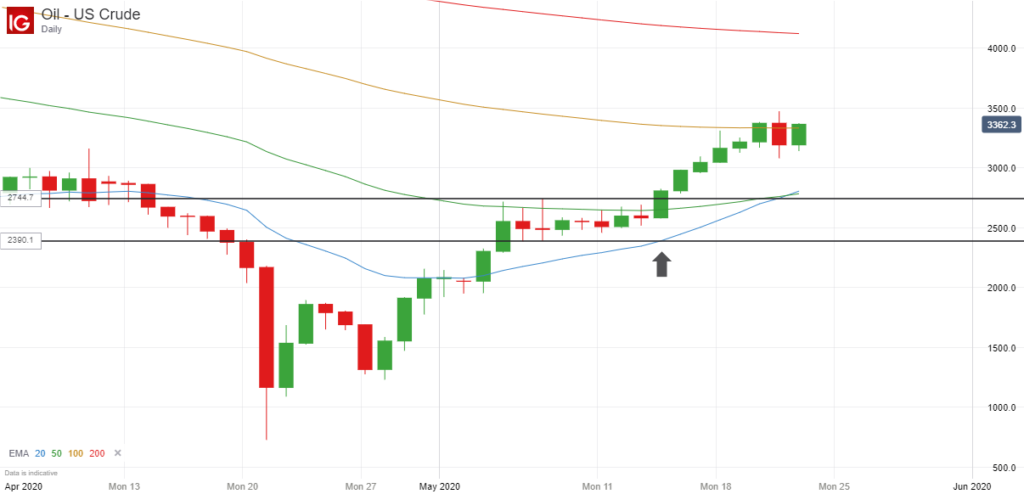
Similarly, with the collapse of the oil price and the subsequent recovery as economies start to open up again, the volatility of the oil markets has gone up dramatically since the start of the year, although it has started to fall since the peak in March and April.

Cryptocurrencies

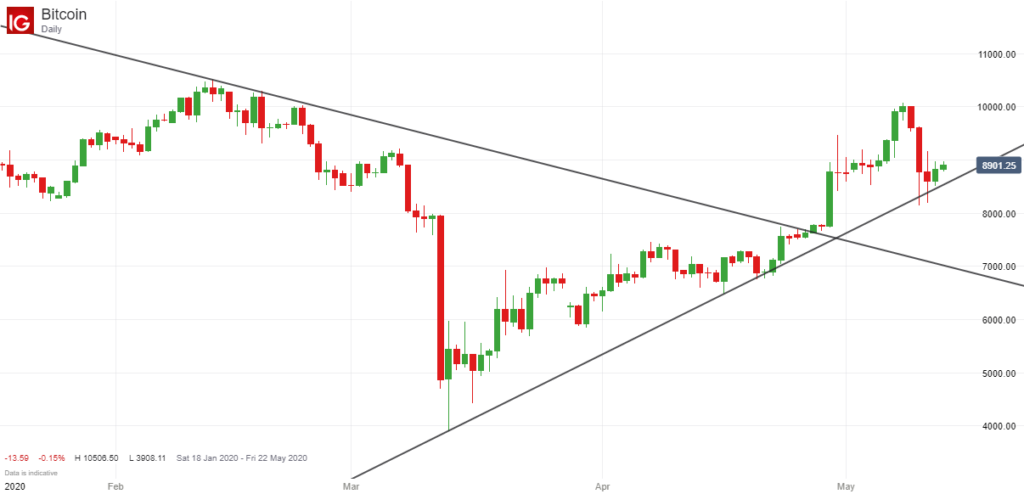
The major cryptocurrencies are notoriously unpredictable and will see spikes in volatility throughout the year, but these too have been affected by the global pandemic.

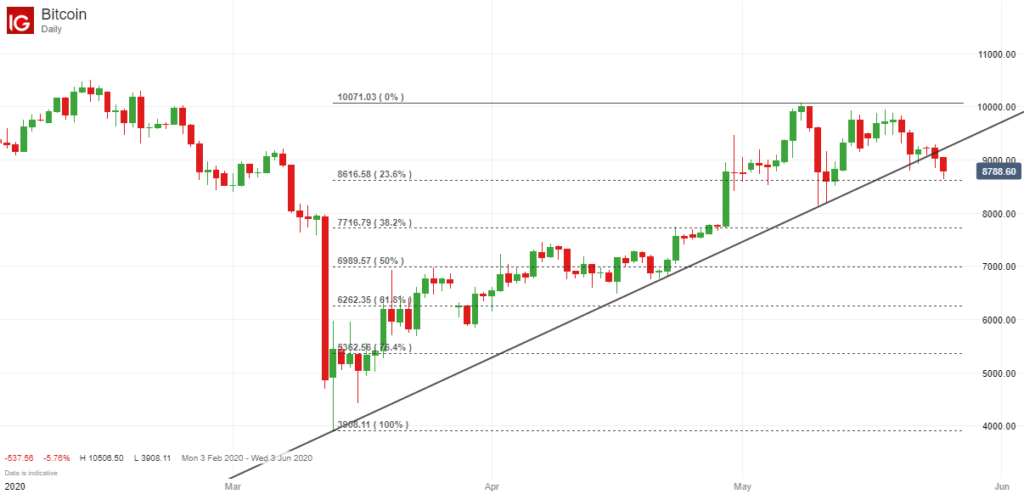
There was a big sell-off in March across the whole crypto sector which obviously led to a big increase in volatility, but there was another upward swing last month, and even now Bitcoin, for example, is still moving 390 points per day on average.

Of course this alone doesn’t make it a great day-trading instrument because spreads are still fairly large with most brokers, but it is still worth noting how much this market moves, even if you are a long-term buy and hold investor.

Closing Comments

2020 has been a very bad year for many long-term investors, but for short-term swing traders and day traders, it has provided plenty of opportunities with lots of wild price swings every day.

The markets have certainly calmed down a little, particularly the forex markets, but it is clear from the average daily trading range figures above that there is still more than enough volatility in the stock market indices, commodities and crypto markets for people to potentially make money.

If you are interested in day trading yourself, it is important to use a broker that has tight spreads and fast execution, and FXTM satisfies both of these criteria, with spreads starting from 0.1 points on ECN accounts and 0.5 points on Standard accounts.

Filed Under: Analysis Tagged With: atr, average true range, daily trading range, volatility

eToro Trading Update – May 2020

May 30, 2020 by James Woolley Leave a Comment

A Modest Gain – Up 0.89%

Last month I was up nicely as we approached the end of April, only to see most of those gains wiped out on the final trading day, and exactly the same thing happened this month as well, much to my disbelief.

I was heading into June with a gain of 4.46% and feeling good about my performance during the month, but the FTSE 100 was down heavily yesterday, and subsequently dragged down the financial and oil stocks in particular, of which I have quite a few in my portfolio.

As a result of all this, I finished the month up 0.89%, which was still better than a loss, but was very underwhelming after I worked so hard to generate profits with my short-term trading.

SteadyProfits eToro Trading Results - May 2020

Trading Performance / Portfolio Update

The portfolio is still well down for the year as a result of this one-day setback, but overall I am not too unhappy with how things stand.

I have banked quite a few profits for my eToro portfolio this month as a result of multiple short-term trades.

For example, I traded in and out of several stocks and ETFs, including ISF, VOO, INVP, AXP, MOMO, RBS, BRK.B and ULVR, and they were all winning trades, with the largest gains coming from MOMO (7.1%) and BRK.B (5.42%).

Investec (INVP) in particular has been a personal favourite of mine this month because I have traded in and out of this stock multiple times, and bought back in once again just a few days ago.

With regards to the remainder of my portfolio, I still have large holdings in the recovering oil sector with BP and Royal Dutch Shell, and also hold a number of financial stocks, such as Aviva, Barclays, Royal Bank of Scotland, Visa and HSBC.

I also have the very undervalued US-listed Chinese app MOMO, and hold ISF and SPY, which track the FTSE 100 and S&P 500 respectively.

Finally, I currently hold a small amount of short-term treasury bonds with SHV to provide a regular monthly income, although this can always be sold if I see some better opportunities in the markets.

Dividends Received

There were very few dividend payments due to be received this month, particularly after many of our companies announced that they were scrapping dividends for the rest of the year.

However we did still receive a small payout from our ETFs, namely SPY and SHV, and we can look forward to some much larger payouts next month, with payouts expected from Visa, BP, Royal Dutch Shell, ISF and SHV.

Copiers

I ended last month with four copiers, but one of those left me this month, so I am now left with three copiers.

Nevertheless, it doesn’t matter if I have 1 or 1000 copiers. I will always do my best to make sure that each and every one of them is profitable.

Risk Score

One reason why it has been hard to attract new performers (apart from my underperformance in 2020) is that my risk score has gone up to 7.

Many people will see this score and instantly assume that I am quite a risky trader, but that’s not the case at all. I always run a long-only portfolio and never use leverage. It has gone up purely because of the volatility of the markets.

Of course I do still want to bring it down if possible, particularly as I know that I have too much exposure to certain sectors, but it is hard to do so right now with many of these stocks trading at very low levels.

Final Thoughts

Overall, it would have been a very good month if it wasn’t for the big fall in the UK market on the last day, so I am not too disappointed. The markets may well recover next week, particularly with the UK and US economies starting to open up again, and I am confident that the oil stocks will bounce back with the oil price rallying strongly late on Friday.

Of course there is still a long way to go just to get back to break-even for the year, but I think the portfolio is heading in the right direction, and as mentioned above, it will be boosted by some decent dividends in June, which will obviously help.

Follow Me on eToro

If you would like to follow my journey on eToro, simply open an eToro account and search for SteadyProfits to view my live trading results and to see my latest trades.

Past performance is not an indication of future results. This content is for information and educational purposes only and should not be considered investment or portfolio management advice. 81% of retail investors accounts lose money when trading CFDs with this provider.

Filed Under: News Tagged With: etoro, steadyprofits

Bitcoin Downward Price Breakout – 25 May 2020

May 25, 2020 by James Woolley Leave a Comment

Bitcoin As An Investment

For a long time I wrote Bitcoin off as nothing more than a purely speculative asset with no real tangible value.

In some respects that still holds true, but with more and more fund managers considering adding it to their portfolio as a way to become more diversified, and as it becomes more accepted as a store of value, I have become increasingly interested in this particular cryptocurrency.

Indeed I am planning to invest 1% of my eToro portfolio into this asset at some point in the future for these very reasons, and am starting to see it as a viable long-term investment for both myself and my copiers.

Downward Price Breakout

The price of Bitcoin has been slowing trending upwards for several months now, and with it trading between $9000 and $10,000, I haven’t been at all tempted to buy in at this kind of price level.

However if you look at the daily price action of Bitcoin just recently, you will see that it has broken below the lower trendline over the weekend and today, indicating that the upward trend may now be over, and we may be seeing the start of a new downward trend.

Bitcoin Downward Price Breakout - 25 May

Therefore I might start becoming more interested in buying Bitcoin if this downward breakout gathers some momentum, and we start to see a serious price move.

At the moment it is too early to tell if this breakout is going to have any real momentum behind it. Ideally we want to see an initial breakout, a pull-back back to the trendline and then a continuation move downwards for confirmation.

If this happens, then we can use fibonacci retracement levels to give us possible price targets, and in this case a 50% retracement of the upward price trend gives us a price of $6989 and a larger 61.8% retracement gives us a target price of $6262.

Either of these two price targets would give me a much better entry point for my 1% investment and would make me a lot more confident about my investment.

Final Thoughts

You may be thinking; is it worth shorting Bitcoin at this point? Well if this was any other instrument and if it had the same chart pattern, then yes it may well be worth opening a short position, but the spreads and fees on Bitcoin are simply too high for my liking.

Furthermore, with Bitcoin there are no fundamental reasons why the price should be higher or lower than it’s current value because nobody knows what it’s true value actually is. It is driven purely by volume of buys and sells, ie sentiment.

I see Bitcoin as a store of value and another means of diversification, and for that reason I am more interested in adding it to my long-term portfolio, but I am not really tempted to trade it up and down at the current time.

That’s why I highlighted this latest downward price breakout. If it starts to head strongly lower and takes out one of the key fibonacci levels, it could then become a buy because at that point it would be highly likely to bounce back, and would also be a great entry point for a long-term investment.

Filed Under: News Tagged With: bitcoin, breakout

Oil Update – 24 May 2020

May 24, 2020 by James Woolley Leave a Comment

Recent Breakout

At the start of this month, I highlighted the price breakout that had occurred on the daily chart of WTI Crude, and suggested that the price may well continue moving up towards the $30 level.

If you follow the oil markets, you probably already know the outcome, but in this article I thought I would provide a quick update to show you what has happened since that time.

This was how the price chart looked when I wrote my last blog post:

WTI Crude Breakout - 4 May 2020

And this is how the price has moved since that original inside bar breakout:

Oil US Crude Daily Chart - 24 May 2020

As you can see, this has turned out to be a very positive breakout trade for those who decided to take it because not only did the price move up to the $30 level, but it actually broke straight through this level, which would ordinarily provide some resistance because it’s a significant round number, and was trading above $34 a short while ago.

Inside Bar Breakout #2

If you didn’t manage to take this trade, the market provided you with a second opportunity to ride this upward trend because there was actually a second inside bar breakout that occurred shortly after the first one.

Oil Chart May 2020 Inside Bar Breakout 2

Zooming in to the recent price action, you can see that after the initial price breakout, there was a fairly large red candle followed by five consecutive inside bars where the price traded within the range of the initial set-up bar, indicated by the two lines.

This was basically telling you that there was a period of indecision after the initial breakout, but when the price broke above, and crucially closed above the upper line on 14 May, traders immediately jumped on board with new long positions and drove the price higher to its recent highs.

The breakout candle closed at around $28, so this would potentially have offered a gain of more than $6, or 20% for those people who traded this second inside bar breakout.

Closing Comments

The point of this article is not to brag about how I called this breakout correctly because I am definitely not in a position to do that. I am not an oil trader myself and didn’t actually take a position on it.

I just wanted to re-emphasise how effective inside bar breakouts can be, regardless of which markets you prefer to trade.

If you can find a price chart where you have a large set-up bar / candle and several consecutive bars / candles that all trade within the range of this initial bar, the odds of success are very high when the price does eventually break out of this narrow trading range.

This is particularly true on the longer time frames because if you take the daily chart, for example, 5-10 consecutive inside bars represents 1-2 weeks of consolidation and indecision, which is a long time in the trading world.

Therefore any resulting price breakout is likely to generate a lot of interest and will often have a lot of volume and momentum behind it when it eventually occurs.

Filed Under: Analysis Tagged With: breakout, inside bar, oil

Bitcoin Still In Upward Trend After 2020 Halving

May 13, 2020 by James Woolley Leave a Comment

Bitcoin Halving

It has been quite a quiet week on the markets so far, but it has been interesting to keep an eye on the Bitcoin price in recent days and weeks because of it’s recent halving.

After every 210,000 blocks are mined, approximately every 4 years, the reward given to miners is halved.

In the past this has ended up having a positive effect on the price, and I think many traders are expecting to see the same pattern emerge this time as well.

Price Action

In my last blog post about this particular cryptocurrency, I highlighted a possible breakout that was looking increasingly likely as the price was trading in a symmetrical triangle with an ever decreasing range.

As you can see in the price chart below, the price of Bitcoin did eventually break out of this trading range, and after closing strongly above this triangle at around $8775, the positive momentum of this breakout helped the price go as high as $10,000 before it started to run into some strong resistance:

Bitcoin Price Trend Post Halving

So this would have yielded some decent profits for anyone brave enough to trade this particular breakout.

Bitcoin Price Action Post-Halving

The price of Bitcoin dropped over $1000 over the weekend as traders got jittery over the high price of Bitcoin and the possible effect of the halving, but after it went through yesterday, the price has remained relatively calm, and has actually traded slightly higher.

The price has formed a base around the $8500 level and has been moving towards the $9000 level.

Furthermore, if you go back to the chart above, you can see that the long-term upward trend, as indicated by the rising trendline, remains intact.

The price has briefly dipped below the trendline but it seems to be offering strong support because it hasn’t yet closed below this line.

This will encourage many long-term Bitcoin investors, many of whom will be hoping that previous post-halving price rises will occur once again.

Final Thoughts

Whether the price of Bitcoin can break through the psychologically important $10,000 level and start a new upward trend remains to be seen, but for the time being at least, the long-term upward trend remains intact.

I still think it is too early for Bitcoin investors to relax though, particularly those who bought recently between $9000 and $10000.

If the price were to close below this trendline in the coming days and weeks, the downside potential could be significant.

We saw over the weekend how quickly the price fell $1000, and with so many traders observing this same trendline, any sustained selling pressure after a downward breakout could easily take the price back down into the $7000’s or lower.

Disclaimer:

Please remember that Bitcoin and other cryptocurrencies are highly speculative instruments, and it is possible to lose all of your capital.

Filed Under: Analysis Tagged With: bitcoin

  • « Previous Page
  • 1
  • …
  • 4
  • 5
  • 6
  • 7
  • 8
  • …
  • 29
  • Next Page »

Forex Rebates:

Choose from 40+ different forex brokers and crypto exchanges, and get cashback every time you trade:


Copy Profitable Traders:

If you join ZuluTrade, you can follow and subscribe to profitable traders and all of their trades will be automatically copied in your own trading account.

You can also earn money as a signal provider if you are already a profitable trader.

Click here to find out more

Recommended Broker:

Recent Blog Posts:

  • High Probability Trade on S&P 500 – 26 January 2024
  • Oanda Moves Into Prop Trading With Labs Trader Program
  • My eToro Performance in 2023 – Up 33.24%
  • The5ers Offering $20K Bootcamp Challenge For Just $1
  • Example of VWAP Bounce Trade on S&P 500 – 18 December 2023

Recent Articles:

VWAP Indicator
  • MA Sabres (LuxAlgo) Indicator
  • 10 Harsh Truths About Forex Trading
  • Best Websites for Monitoring Currency Strengths
  • Xmaster Formula Indicator for MT4 and MT5
  • Tools:

    Currency Heat Map

    Categories

    • Analysis
    • News

    Archives

    • January 2024
    • December 2023
    • November 2023
    • October 2023
    • September 2023
    • August 2023
    • July 2023
    • June 2023
    • May 2023
    • August 2020
    • June 2020
    • May 2020
    • April 2020
    • January 2020
    • December 2019
    • November 2019
    • October 2019
    • September 2019
    • August 2019
    • July 2019
    • June 2019
    • May 2019
    • April 2019
    • March 2019
    • February 2019
    • January 2019
    • December 2018
    • November 2018
    • October 2018
    • September 2018
    • August 2018
    • July 2018
    • June 2018
    • May 2018
    • March 2016
    • December 2015
    • November 2015
    • October 2015
    • August 2015
    • July 2015

    Disclaimer

    This website should be used for general information purposes only and in no way represents professional financial advice.

    Forex and CFD trading carries a high level of risk and it is possible to lose more than your initial deposit if using leveraged products.

    Copyright © 2025 · eleven40 Pro Theme on Genesis Framework · WordPress · Log in

    • About
    • Contact
    • Disclosure
    • Privacy Policy
    • Terms Of Service