The Forex Chronicles

  • Rebates
  • Brokers
  • News
  • Analysis
  • Signals
    • Best Copy / Social Trading Platforms
    • eToro Review
    • FXTM Invest Review
    • Marketclub Review
    • ZuluTrade Review
  • Indicators
  • Strategies
  • Articles

Crude Oil Breakout From 4 May 2020

May 10, 2020 by James Woolley Leave a Comment

Price Action

If you have been watching the price of oil in recent weeks and months, you will know that it has been on a crazy ride just recently.

Indeed there was a brief time when the oil price actually went negative when the latest contract expired, which was an unprecedented event that has never happened before.

The price had already tumbled as a result of tensions between Saudi Arabia and Russia, followed by the sharp drop-off in demand caused by global lockdowns, but the constant shorting of oil pushed the spot price of WTI Crude Oil down to just $7 per barrel.

Breakout

As countries have started to reopen for business, the price of WTI Crude has started to slowly rise again, and in this article I want to highlight a breakout that occurred last week that you may have missed.
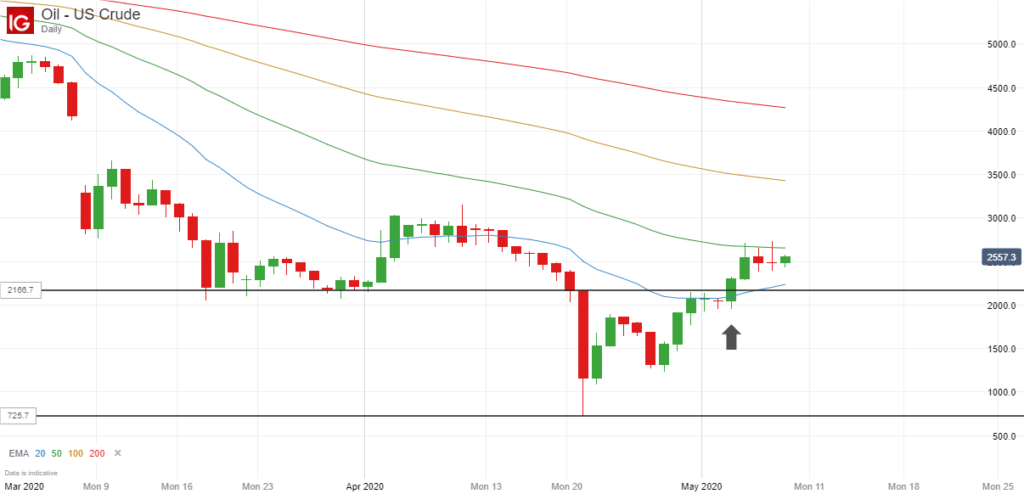
WTI Crude Breakout - 4 May 2020

Inside bar breakouts are some of the most profitable breakouts you can trade if you wait for the right set-ups, and this was a decent example of a high probability set-up.

As you can see, there was initially a large red candle on 21 April 2020, but for the next ten trading sessions, the price of WTI Crude actually stayed within the entire range of this candle. So in other words, there were ten consecutive inside bars.

When this happens, there is often a strong breakout when the price finally breaks out of the range of this inside bar (and closes outside it), and that’s exactly what happened here.

On 4 May 2020, the price broke upwards out of this range and closed at almost exactly $23.

This would have been a good point to enter a long position because the price then went up to $27.15 the following day, representing a potential gain of $4.15.

Since then the price has dropped back to around the $25 mark, but I think many traders are expecting the momentum of this breakout to continue, with the price heading up towards the $30 level at some point.

Final Thoughts

I didn’t actually take this trade myself because I don’t like to trade oil on eToro (my risk score is high enough already thanks to my BP and RDSB stock holdings), but I just wanted to highlight how profitable these inside bar breakouts can be.

Just having two consecutive inside bars can be enough to give you a strong breakout trading opportunity, but it is often the case that your odds of success increase even more when you have several of these inside bars within the range of the initial candle.

That’s why I wanted to demonstrate with this example because here we had ten inside bar candles in a row, thanks to the extraordinarily large set-up candle that spooked the markets and prompted so many headlines.

It’s interesting to note that if you go back to the price chart and look at the price action before this large drop-off, you will see that there was a downward inside bar breakout just prior to this as well.

This would have got you into a short position at around $26.60, just before the big fall of nearly $20, but we can all be wise after the event, and in reality, many traders would probably have banked their profits before the price collapsed from $22 to $7.

The point is that you want to keep an eye out for these inside bar set-ups. They work really well on the longer time frames in particular, and when they occur at a peak or a trough, the resulting breakouts can potentially be large enough to give you some good gains.
Filed Under: Analysis Tagged With: breakout, inside bar, oil

eToro Trading Update – April 2020

May 2, 2020 by James Woolley Leave a Comment

An Eventful But Flat Month – Down 0.66%

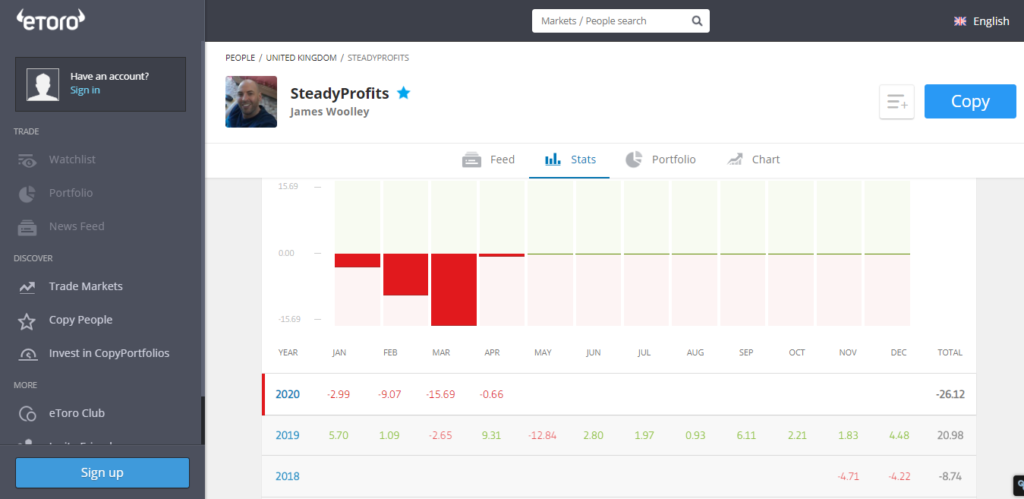
March was the month when the markets really plummeted around the world, with my own eToro portfolio falling in value by 15%, but April also turned out to be quite an eventful month.

The stock market falls continued and I was experiencing more losses at the start of the month, before the markets picked up again towards the end and at one point I was up just under 5% at the close of play on Wednesday.

However all of Wednesday’s gains were wiped out on the last day of the month, and I ultimately ended down 0.66% for the month.

SteadyProfits eToro Performance Results - April 2020

Trading Performance / Portfolio Update

The fallout from the coronavirus has undoubtedly had a massive impact on my portfolio, however the fallout from the oil price collapse has been just as damaging.

In addition to all of my UK banks scrapping their dividends for the remainder of 2020, Royal Dutch Shell announced on Thursday that they are cutting their dividend payouts by around two thirds.

As a result of all this, I will now have significantly less dividend income coming in during the rest of the year. BP have said they will retain their dividend (for now), but apart from that healthy payment, it is only ISF, SPY, Visa and SHV that are providing any kind of income.

My three largest holdings are still BP, Royal Dutch Shell and HSBC, and I remain invested in Aviva, Barclays, Royal Bank of Scotland and Visa, and although they are all likely to remain low in the coming months, they should all recover over time.

I am also invested in ETFs that track the FTSE 100 and the S&P 500, and these will be held for years and years. I also have the short-term bond ETF SHV to provide a little income and protect my portfolio.

While I wait for my portfolio to recover, I am still actively trading in and out of stocks to generate some short-term gains for myself and my copiers.

This month I traded in and out of Barclays, BP, Google, Investec and Visa, and sold my Google shares for a small profit, but my best trade was American Express, which I bought at $82.34 and sold just one week later at $92.11 for a profit of 11.87%.

So it wasn’t a bad month overall with regards to my trading.

Dividends Received

As alluded to above, many dividends have been cut, but we did at least receive a dividend from SPY at the end of the month, although this is really small compared to many of our UK dividend stock payouts.

Copiers

Despite the poor performance of my trading portfolio, I still have 4 copiers as of the end of April, who I am very grateful for for sticking with me. I am working hard to ensure that all of them will see healthy profits in the future.

Risk Score

The volatility of the markets has meant that nearly all stocks have been assigned a higher risk score, which in turn has left me with a higher risk score of 7, despite the fact that I haven’t really made any major changes to my portfolio.

I think BP and Royal Dutch Shell are the two main culprits, particularly as they make up such a large part of my portfolio, but I am not going to sell either of them at these levels just to bring my risk score down.

Final Thoughts

After being up nearly 5% with one trading day left, I am obviously very disappointed to finish the month down 0.66%.

However moving forward I am fairly happy with the make-up of my portfolio, and remain confident that it will rise to previous highs once again once the worst of the coronavirus is behind us.

This is still some way off in my opinion, but I wouldn’t be surprised if the S&P 500 makes new highs as early as next year.

In the meantime I will continue to trade in and out of stocks to capitalize on the market volatility right now, and pick up any bargains for the long-term with any leftover cash.

Follow Me on eToro

If you would like to follow my journey on eToro, simply open an eToro account and search for SteadyProfits to view my live trading results and to see my latest trades.

Past performance is not an indication of future results. This content is for information and educational purposes only and should not be considered investment or portfolio management advice. 81% of retail investors accounts lose money when trading CFDs with this provider.

Filed Under: News Tagged With: etoro, steadyprofits

Potential Bitcoin Breakout – April 2020

April 20, 2020 by James Woolley Leave a Comment

Bitcoin Trading

Bitcoin has always been a popular instrument for long-term buy and hold investors because many people see the long-term value of this particular cryptocurrency, and believe that it will be trading a lot higher in the years to come.

However it has also become a very popular market for short and medium-term traders to trade because many people have found that it follows similar patterns as the more conventional trading instruments (stocks, indices, commodities, etc), and works really well with technical analysis.

So with that in mind, I want to offer my latest analysis of Bitcoin’s recent price action, and highlight why it may be set for a possible breakout in the near future.

Recent Price Action

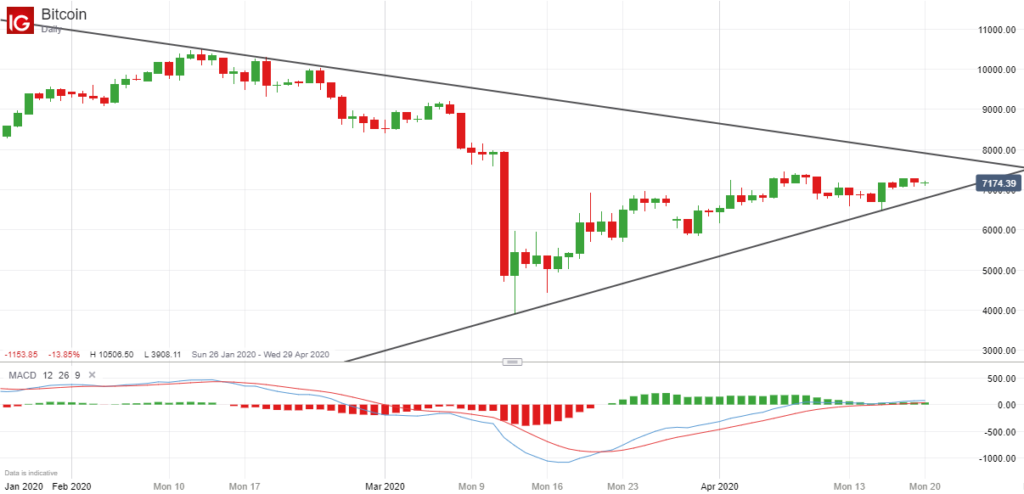
As you can see from the price chart below, the price has been trading within a descending triangle for much of 2020.

Bitcoin Price Chart - April 2020

It reached a high of around $10,500 back in February, and posted a low of around $3900 on 13 March 2020, after losing approximately half its value in just two days of relentless selling.

Since hitting that low point, the price has been slowly trending upwards, trading just above $7000, and now seems to be somewhat stuck in a sideways trading range, undecided about which direction to take.

Possible Breakout

This indecisiveness, combined with the descending triangle pattern, suggests to me that we may be about to see a significant breakout once the price breaks decisively out of this triangle.

At the moment it is hard to see the price of Bitcoin breaking strongly upwards because if you look at a few other indicators, you can see that this upward price movement is starting to run out of momentum.

For example, there is divergence on both the MACD and MACD histogram indicators, and both are looking like they might be about to cross downwards, indicating the start of a new downward trend.

If the price were to break below the psychologically important 7000 level, and then close below the lower trendline of the descending triangle, ie below 6900, then it could easily fall back to the 6000 level in a short space of space, and possibly as low as 5000 over time if this breakout gathers momentum.

If, on the other hand, it could move as high as 8000 and break decisively upwards out of this triangle, then it wouldn’t be at all surprising to see it reach 9000 or 10,000 once again, but in this economic climate, this seems unlikely in my opinion.

Final Thoughts

It’s important to point out that these are just my own thoughts and opinions, and is not intended to be financial advice. It’s perfectly possible that there could be a false breakout and the price remains range-bound for the foreseeable future.

However it is still interesting to see how these descending triangles unwind because they will often end with a significant price move upwards or downwards, and with so much sideways price action in recent weeks, that may well happen here with Bitcoin.

You can be sure that many other traders and investors are waiting for some kind of breakout, so as is so often the case, it may become a self-fulfilling prophecy once traders jump on board and trade the resulting breakout as soon as it occurs. Stay tuned.

Filed Under: News Tagged With: bitcoin, breakout

3000 Could Be Key Resistance Level For S&P 500

April 16, 2020 by James Woolley Leave a Comment

2020 Price Action So Far

It is fair to say that 2020 has been a complete disaster for many stock market investors thanks to the global coronavirus pandemic that has effectively closed down the world’s economy.

You only have to look at the price chart of any mid-large cap stock, or any major stock market index for evidence of this.

The S&P 500 is a classic example. Even as recently as February, this index was closing in on 3400 and making new all time highs before the virus started spreading outside China.

However things really turned negative in March as the effects started to be felt in many countries all over the world, with thousands of new infections and rapidly growing death rates ultimately leading to complete lockdowns and the closure of many businesses.

Subsequently, the S&P 500 fell all the way down to around 2200 at one point, so it is quite remarkable that it has since recovered back up to the 2800 level.

Strong Resistance

At the moment, however, it is hard to see this upward price move continuing for much longer.

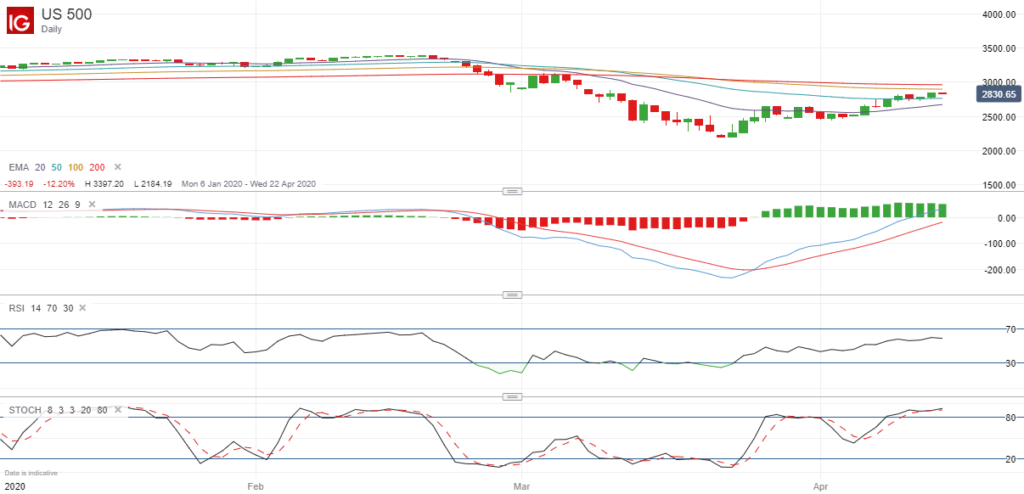
As I posted on my eToro feed yesterday, it is getting closer to its 200-day exponential moving average, which by itself often acts as strong resistance.

However the fact that this indicator is also very close to the 3000 level, ie a major round number, makes this even more significant because it is likely to provide even stronger resistance.

Here is the chart that I posted yesterday:

SPX500 - 15Apr

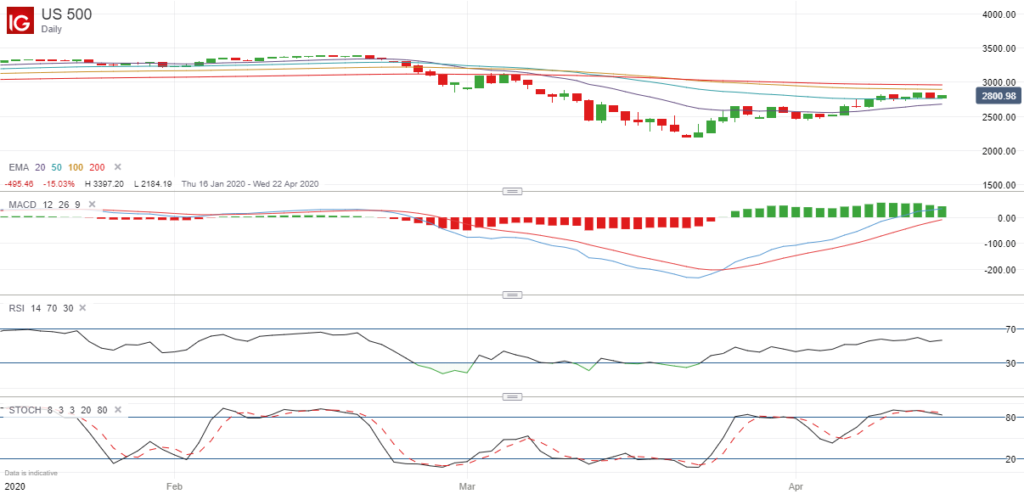
Since then, the S&P 500 has fallen from 2830 to it’s current overnight level of 2800, and all of the additional indicators are still suggesting that this market is currently in overbought territory and likely to fall, as you can see below:

SPX500 -April 16

The MACD histogram is slowly falling as the price has been rising and the stochastic indicator is still above 80, suggesting it has potentially reached a peak. The only exception is the RSI indicator because this has not yet crossed above 70, suggesting that the price could yet go slightly higher.

However this latest price chart is still pointing towards further weakness in the coming days and weeks.

The Fundamental Argument

It is all well and good looking at the price charts to make trading decisions, but it is often good to look at the fundamentals as well.

The S&P 500 has been trading on a large P/E ratio for several years now, prompting many to sell their index ETFs, VOO, SPY, etc, and wait for a reversal to buy back in cheaper.

Even though the index is well below it’s all-time high, the fact remains that it is still trading on a very high multiple. As of yesterday, iShares’ IVV was still trading on a P/E ratio of 18.75, and this doesn’t really account for the fact that the earnings part of this formula is likely to fall sharply later this year, pushing the P/E up even further.

Final Thoughts

So these are some of the reasons why I think the S&P 500 is likely to fall in the near future. There are strong arguments both fundamentally and technically why the S&P 500 could easily drop to 2500 again, and possibly even further.

When you also take into consideration the fact that we are still a long way off developing a vaccine for COVID-19, and many countries are still in lockdown, it really is hard to put forward any arguments why this index should rise much further at the present time.

Filed Under: Analysis Tagged With: s&p500, spx

eToro Trading Update – March 2020

April 1, 2020 by James Woolley Leave a Comment

Worst Month So Far – Down 15.69%

First of all, I would like to apologise for not continuing to post monthly updates about my eToro progress in recent months.

As many of you will know, March has been a terrible month for stock market investors, so I thought now would be the perfect time to write a new update.

The impact of COVID-19 around the world has had a devastating impact on many countries’ economies and has decimated many people’s portfolios as a result, including highly respected fund managers such as Ray Dalio.

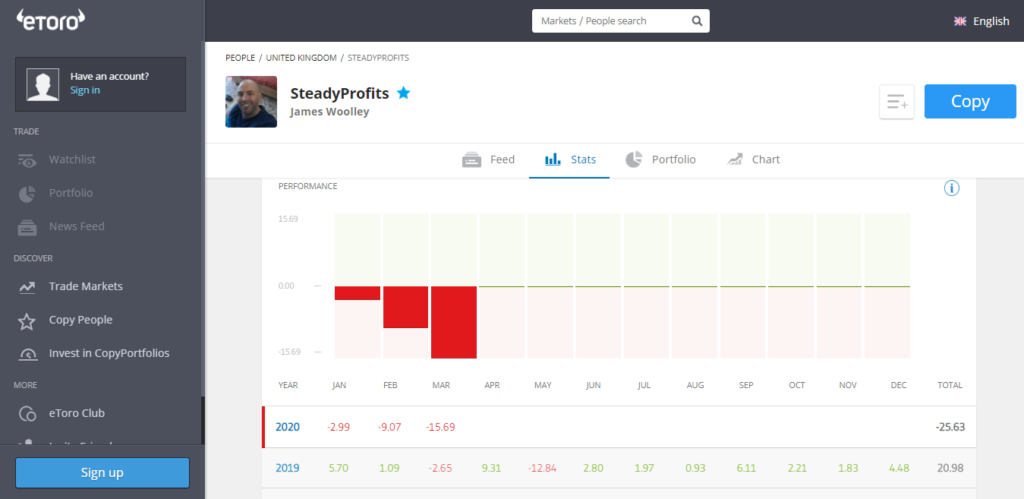
I have suffered as well because after the final day of trading, my account was down 15.69% in March, following on from a fall of 9.07% in February and a 2.99% fall in January.

SteadyProfits Performance Stats - March 2020

Trading Performance / Portfolio Update

Many people assume that the coronavirus is responsible for most of these losses, but in my case, the ongoing dispute between Saudi Arabia and Russia has also had a major impact because this has driven the price of oil down to just $22 in the case of WTI Crude.

Subsequently, I have seen the share price of two of my largest holdings, BP and Royal Dutch Shell, fall by as much as 50% before bouncing back to a slightly more respectable level.

Other companies in my portfolio have performed equally as badly thanks to the enforced lockdown in the UK and elsewhere.

For example, HSBC is down over 20%, Aviva is down over 30% and RBS and Barclays are both down around 34%. Even my FTSE 100 tracker is down nearly 22%.

My US stocks and ETF have performed a little better because I purchased these a little later using the proceeds from my bond ETF sales.

Visa is down around 19%, Google 11% and SPY (a popular S&P 500 tracker) around 16%.

In short, everything is down a lot but I am not currently selling anything for a loss because these are all good quality companies / ETFs that should all go back into profit over time once we start to eradicate COVID-19.

Most of them pay very generous dividends in the meantime, although I am just hearing that UK banks are all cancelling any future dividends for the remainder of 2020, which is obviously a big blow.

It should be noted that it hasn’t all been doom and gloom because as mentioned above, I sold three of my bond ETFs for decent profits last month, and I also made a profit of over 15% on a short-term trade in Barclays.

Dividends Received

eToro have recently changed the way that payments are received so that they are now in line with most other brokers. Instead of paying out dividends on the ex-dividend date, they now pay the dividends on the official payment date for each company.

As a result of this, I received dividends last month from a few companies that went ex-dividend in February, including Visa, ISF, BP and Royal Dutch Shell, so this provided a decent income to mitigate some of the heavy losses.

This month there are more dividends due to be paid out from SPY, but the anticipated dividends from Barclays and HSBC have now been cancelled.

Copiers

At the start of the year I had as many as 8 copiers copying my trades at one point, but with the global stock market collapse, I now only have 3 copiers, which is perfectly understandable.

I am invested for the long-term with short-term trades boosting profits in the meantime and am fully prepared to ride out any storms, but everyone has their reasons to stop copying someone.

Risk Score

As a result of some wild fluctuations in the value of my portfolio, my risk score has gone up from 4 to 6, which is obviously not ideal. Hopefully this will fall once the markets settle down a little bit and stop moving several percentage points in one day. If not, I may have to trim some of my larger holdings.

Final Thoughts

Overall, I am not too unhappy with the overall loss of 15.69% in March, as crazy as that may sound. I was actually down a lot more at one point when the FTSE and S&P 500 were down significantly more than they are today.

The key thing you have to do during a crisis is to avoid panic selling. As long as you are invested in good quality stocks and ETFs, you should be OK in the long run, however long that may take, and I believe I have a good mixture of both.

So for now I am just continuing to bank any dividends and waiting for this coronavirus nightmare to be over. Stay inside, stay healthy and keep buying at low prices is my philosophy for the immediate future.

Follow Me on eToro

If you would like to follow my journey on eToro, simply open an eToro account and search for SteadyProfits to view my live trading results and to see my latest trades.

Past performance is not an indication of future results. This content is for information and educational purposes only and should not be considered investment or portfolio management advice. 81% of retail investors accounts lose money when trading CFDs with this provider.

Filed Under: News Tagged With: etoro, steadyprofits

  • « Previous Page
  • 1
  • …
  • 5
  • 6
  • 7
  • 8
  • 9
  • …
  • 29
  • Next Page »

Forex Rebates:

Choose from 40+ different forex brokers and crypto exchanges, and get cashback every time you trade:


Copy Profitable Traders:

If you join ZuluTrade, you can follow and subscribe to profitable traders and all of their trades will be automatically copied in your own trading account.

You can also earn money as a signal provider if you are already a profitable trader.

Click here to find out more

Recommended Broker:

Recent Blog Posts:

  • High Probability Trade on S&P 500 – 26 January 2024
  • Oanda Moves Into Prop Trading With Labs Trader Program
  • My eToro Performance in 2023 – Up 33.24%
  • The5ers Offering $20K Bootcamp Challenge For Just $1
  • Example of VWAP Bounce Trade on S&P 500 – 18 December 2023

Recent Articles:

VWAP Indicator
  • MA Sabres (LuxAlgo) Indicator
  • 10 Harsh Truths About Forex Trading
  • Best Websites for Monitoring Currency Strengths
  • Xmaster Formula Indicator for MT4 and MT5
  • Tools:

    Currency Heat Map

    Categories

    • Analysis
    • News

    Archives

    • January 2024
    • December 2023
    • November 2023
    • October 2023
    • September 2023
    • August 2023
    • July 2023
    • June 2023
    • May 2023
    • August 2020
    • June 2020
    • May 2020
    • April 2020
    • January 2020
    • December 2019
    • November 2019
    • October 2019
    • September 2019
    • August 2019
    • July 2019
    • June 2019
    • May 2019
    • April 2019
    • March 2019
    • February 2019
    • January 2019
    • December 2018
    • November 2018
    • October 2018
    • September 2018
    • August 2018
    • July 2018
    • June 2018
    • May 2018
    • March 2016
    • December 2015
    • November 2015
    • October 2015
    • August 2015
    • July 2015

    Disclaimer

    This website should be used for general information purposes only and in no way represents professional financial advice.

    Forex and CFD trading carries a high level of risk and it is possible to lose more than your initial deposit if using leveraged products.

    Copyright © 2025 · eleven40 Pro Theme on Genesis Framework · WordPress · Log in

    • About
    • Contact
    • Disclosure
    • Privacy Policy
    • Terms Of Service