The Forex Chronicles

  • Rebates
  • Brokers
  • News
  • Analysis
  • Signals
    • Best Copy / Social Trading Platforms
    • eToro Review
    • FXTM Invest Review
    • Marketclub Review
    • ZuluTrade Review
  • Indicators
  • Strategies
  • Articles

Bitcoin Surges Above $8000 After Inside Bar Breakout

May 16, 2019 by James Woolley Leave a Comment

Previous Price Action

For a long while, it looked like the price of Bitcoin was just going to continue to trade in a sideways trading range between $3500 and $4000.

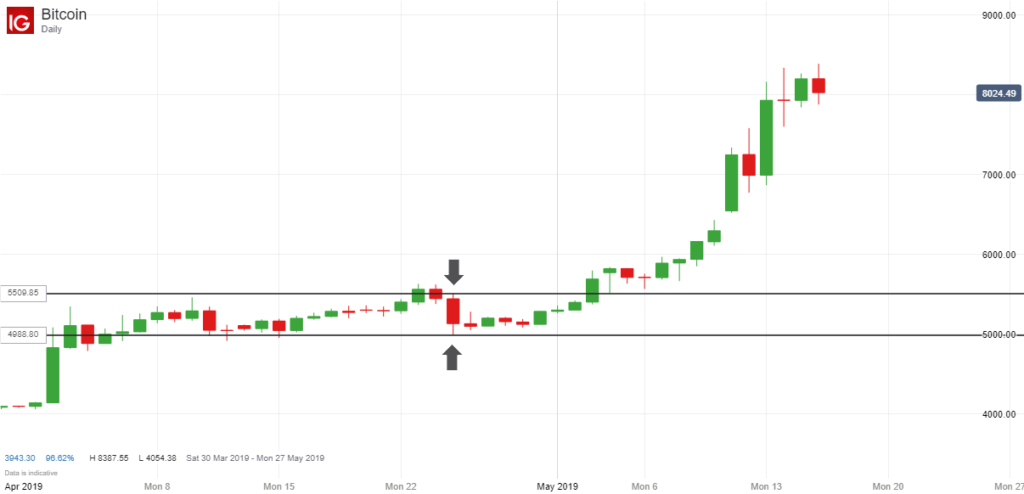
However there was a large breakout candle on 2 April, and in the following days there was enough momentum to push the price above the key $5000 level.

The price then stabilized between $5000 and $5600 for the next three weeks or so and it looked like this was going to be the new trading range in the following days and weeks.

Inside Bar

On 25 April, however, there was quite a large bearish candle on the daily chart, which propelled the price back towards $5000, and it looked like it could be heading a lot lower if it could close below this level.

As it turned out, the downward breakout failed to materialise and this actually became an inside bar because the trading range of the next seven days all fell within the high and low of this initial inside bar.

This is always a good thing to see on the daily chart because it is often the pre-cursor to a large breakout either upwards or downwards, and that’s exactly what happened here.

Upward Price Breakout

As you can see in the chart below, the price eventually broke out of this trading range (and closed above the high of the inside bar) on 3 May at $5689, and this would have been a great time to enter a long position because the price has since surged to more than $8000 thanks to the upwards momentum of this breakout.

Bitcoin Inside Bar Breakout - April May 2019

This would have represented a gain of nearly 50% for those people who held on to this position until now, but $6000 was breached fairly easily and a gain of 10-20% was still easily achievable once the momentum started building.

Final Thoughts

The point I want to get across is that as I have highlighted many times before on this site, these inside bar breakouts are always worth looking out for on the daily price charts because they can be extremely profitable.

You will generally find that the longer the price trades within the range of the initial set-up bar, also referred to as an inside bar, the more likely it is that there will be a strong breakout when the price closes outside of this range, and that was exactly the case here.

In this instance the price of Bitcoin traded within the range of the initial set-up bar for seven consecutive days, and so it was almost inevitable that the price would continue to rise strongly once the price closed outside of this range.

The problem is that these inside bars don’t necessarily occur that often, but if you monitor lots of different currency pairs, and a range of cryptocurrencies, indices and commodities, you should find a few really good set-ups every month.

Filed Under: Analysis Tagged With: bitcoin, breakout, inside bar

Leave a Reply Cancel reply

Your email address will not be published. Required fields are marked *

Forex Rebates:

Choose from 40+ different forex brokers and crypto exchanges, and get cashback every time you trade:


Copy Profitable Traders:

If you join ZuluTrade, you can follow and subscribe to profitable traders and all of their trades will be automatically copied in your own trading account.

You can also earn money as a signal provider if you are already a profitable trader.

Click here to find out more

Recommended Broker:

Recent Blog Posts:

  • High Probability Trade on S&P 500 – 26 January 2024
  • Oanda Moves Into Prop Trading With Labs Trader Program
  • My eToro Performance in 2023 – Up 33.24%
  • The5ers Offering $20K Bootcamp Challenge For Just $1
  • Example of VWAP Bounce Trade on S&P 500 – 18 December 2023

Recent Articles:

VWAP Indicator
  • MA Sabres (LuxAlgo) Indicator
  • 10 Harsh Truths About Forex Trading
  • Best Websites for Monitoring Currency Strengths
  • Xmaster Formula Indicator for MT4 and MT5
  • Tools:

    Currency Heat Map

    Categories

    • Analysis
    • News

    Archives

    • January 2024
    • December 2023
    • November 2023
    • October 2023
    • September 2023
    • August 2023
    • July 2023
    • June 2023
    • May 2023
    • August 2020
    • June 2020
    • May 2020
    • April 2020
    • January 2020
    • December 2019
    • November 2019
    • October 2019
    • September 2019
    • August 2019
    • July 2019
    • June 2019
    • May 2019
    • April 2019
    • March 2019
    • February 2019
    • January 2019
    • December 2018
    • November 2018
    • October 2018
    • September 2018
    • August 2018
    • July 2018
    • June 2018
    • May 2018
    • March 2016
    • December 2015
    • November 2015
    • October 2015
    • August 2015
    • July 2015

    Disclaimer

    This website should be used for general information purposes only and in no way represents professional financial advice.

    Forex and CFD trading carries a high level of risk and it is possible to lose more than your initial deposit if using leveraged products.

    Copyright © 2026 · eleven40 Pro Theme on Genesis Framework · WordPress · Log in

    • About
    • Contact
    • Disclosure
    • Privacy Policy
    • Terms Of Service
    We use cookies to ensure that we give you the best experience on our website. If you continue to use this site we will assume that you are happy with it.OK