The Forex Chronicles

  • Rebates
  • Brokers
  • News
  • Analysis
  • Signals
    • Best Copy / Social Trading Platforms
    • eToro Review
    • FXTM Invest Review
    • Marketclub Review
    • ZuluTrade Review
  • Indicators
  • Strategies
  • Articles

High Probability Trade on S&P 500 – 26 January 2024

January 27, 2024 by James Woolley Leave a Comment

Introduction

Many traders are sceptical about whether or not you can find high probability set-ups on the lower timeframes because the price can move around so fast, and seemingly at random a lot of the time.

However I believe that it is still possible to find good quality trades on these lower timeframes because I regularly take these trades myself on the 5-minute chart of the major stock market indices, and tend to have a decent hit rate.

Some of the very best traders just use price action alone to find high probability trades, such as Al Brooks, for example, but I like to have a few additional indicators on the chart for guidance.

These include the VWAP indicator, the stochastic indicator and several moving averages, and just yesterday (26 January 2024) they all combined to provide a high probability set-up on the S&P 500, as I will demonstrate in the rest of this article.

The Set-Up

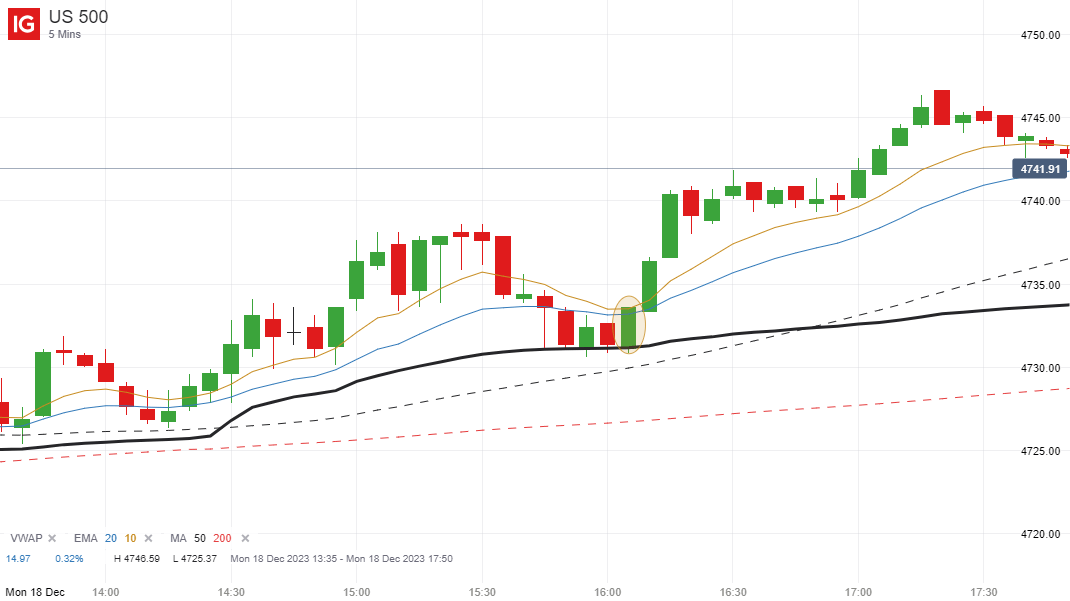
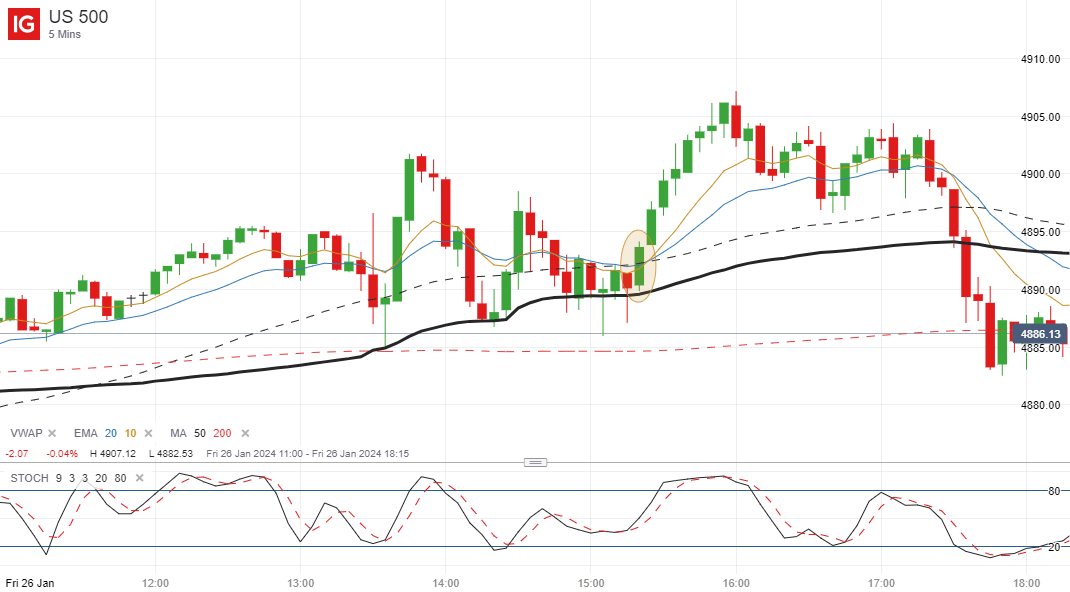
As you can see in the 5-minute chart below, the price of the S&P 500 opened slightly higher when the market opened at 14.30 (UK time) before dropping back towards the VWAP indicator (shown in black), where we saw a lot of sideways price action and indecision around this key indicator.

Crucially, the price failed to close below the VWAP and was also trading close to the 10, 20 and 50-period exponential moving averages, so this was all pointing to a possible breakout.

Trade Execution

I was already going into the trading session with a bias to the long side because the trend was so bullish on the higher timeframes.

So when the price bounced off the VWAP, and closed above these three moving averages with one very strong 5-minute candle, I was ready to enter a long trade if the price broke the high of this candle, which it duly did.

The fact that the price closed above the highs of the previous 6 candles and was showing significant divergence on the stochastic indicator at the bottom of the chart just gave me added confidence that this was going to be a strong breakout.

I ended up entering a long position on this initial breakout at 4894.4 and closed half the position at 4900 because this was a major round number that could have acted as strong resistance, and the other half at 4905 after the price had continued pushing higher without any red candles.

As a result, I banked a total profit of just over 8 points from the two positions combined.

Closing Comments

You can see from the chart above that the price of the S&P 500 subsequently dropped back later in the session, but that was irrelevant.

The point is that at that particular time, the indicators and price action were all pointing to a breakout to the long side, and when I see a confluence of indicators like this and a tightness of price action prior to the breakout, this is a time when I like to take a position.

It is rare to see the price of this particular market trading in a narrow sideways range around key indicators at the start of a session, but when you do, you know that in most cases there will eventually be a breakout and a strong surge in one direction or the other, even if it doesn’t last for the whole day.

So it is always worth keeping an eye out for these high probability set-ups because they do come up on a regular basis, even on the 5-minute chart, which is my preferred shorter term timeframe.

They won’t always be profitable of course, but by using tight stop losses, there should be more winning trades than losing trades, and the profits from these trades should exceed any losses that you may incur.

Filed Under: Analysis Tagged With: divergence, s&p500, vwap

Example of VWAP Bounce Trade on S&P 500 – 18 December 2023

December 19, 2023 by James Woolley Leave a Comment

Introduction

I just uploaded a new article to this site a few days ago that took a closer look at the VWAP indicator, and how it can benefit stock, indices and forex traders, particularly those who like to day trade these markets on the lower timeframes.

In this article I pointed out that one of the best set-ups is when you get an initial move higher followed by a retracement back down to the VWAP indicator because this is where you will often see a strong level of support, and in many cases a nice bounce higher.

Well as it turned out, we got a textbook VWAP bounce on the S&P 500 only yesterday and it is this trade example that I want to walk you through today.

S&P 500 Trade Set-Up

As you are probably aware, the markets have been really strong in December and getting close to new all-time highs.

Subsequently, if you would have looked at the longer timeframes on the S&P 500 at the opening bell yesterday, you would have seen that the price was above the 10 and 20 exponential moving averages on the monthly timeframe all the way down to the 4-hour timeframe, and had just popped above them on the 1-hour chart as well.

Therefore the trend was ultra-bullish, and you should only really have been looking for opportunities to go long because you would really have been swimming against the tide if you had attempted to short this market.

One way of doing this is waiting for a retracement and then taking a long position when the price moves upwards through these moving averages on a lower timeframe, but VWAP bounces can be just as effective when they occur.

Obviously if you get a VWAP bounce and a move through the moving averages, that’s even better!

Trade Execution

In the case of yesterday’s price action on the S&P 500, we did see an initial move higher, but short-term traders will have noticed that the price started to retrace back towards the VWAP on the 5-minute chart after the first hour of trading.

As I mentioned earlier, with the underlying trend being so strong, this is the area where traders should consider going long if buyers started to step in, and the close of the highlighted candle was a good time to do so.

This is where we saw the first strong bounce off the VWAP, and we also saw the price break through the prior highs from the previous two candles as well. Plus it also closed at the high of the candle, which was another sign of strength.

You will also see that the price just about closed above both the 10 and 20-period exponential moving averages as well, so this was a really high probability set-up.

Your losses could be easily capped by placing a stop loss just underneath the most recent low, or somewhere just below the VWAP indicator, and your potential gains to the upside are essentially unlimited.

Closing Comments

It’s always important to point out that these and other similar set-ups are not completely foolproof.

There will be times when the price will look like it is bouncing back off the VWAP indicator, but then burst straight through it and continue moving lower, but if you manage your losses, this isn’t a problem and is just part of trading.

The key to successful trading is to find opportunities to put the odds of success in your favor, and trading VWAP bounces is one way of doing this if you wait for the right set-ups.

Filed Under: Analysis Tagged With: s&p500, vwap

Multi-Timeframe and Divergence Oil Trade – 7 December 2023

December 8, 2023 by James Woolley Leave a Comment

Introduction

I’ve been asked several times to document some trades that are based on multi-timeframe analysis because people seem to really resonate with this particular trading strategy, so in today’s article I want to discuss a very nice set-up that occurred on US crude oil yesterday afternoon.

With multi-timeframe analysis I like the weekly, daily and 4-hour charts to be trending in the same direction, with the price ideally above or below their 10 and 20-period moving averages on each one.

Then I want to see a pullback on the 1-hour chart followed by a trend resumption in alignment with the three longer term charts, which is where I will enter a position.

US Crude Oil Set-Up

In the case of US crude oil, the price has been trending downwards on the weekly and daily chart for a while now, and was showing a little more strength on the 4-hour chart. However it was still trading below my preferred moving averages (the 10 and 20 EMA) on this timeframe too, as you can see below:

This is exactly what I was hoping to see, and it was actually perfectly set-up for a 1-hour pull-back and entry on Wednesday, but I was reluctant to trade on that day because the crude oil inventories figure was due to be released later in the afternoon, and could have had a positive or a negative effect on the trade.

As it turned out, this would have been a very profitable trade as it moved strongly downwards prior to the data release, but luckily there was another nice set-up on Thursday where the price resumed its downward trend after a brief pullback.

Trade Entry

As you can see, there were actually two potential set-ups earlier in the day, at the close of the 5.00 and 11.00 candles, but these were low probability trades because they occurred during the quietest periods of the day when volume for US crude oil is very light. So there was unlikely to be any strong momentum behind any downward move even if the trend were to continue.

The close of the highlighted 3PM candle was a much better set-up even though it was a little late in the day because it was a bigger downward candle and there was a lot more volume behind the price drop because it occurred in the first few hours of the US session.

Furthermore, if you look at the stochastics indicator in the bottom panel of the chart, you will see that there was a nice double top divergence pattern that showed that this upward price move was running out of momentum. Plus it also dropped below the black VWAP indicator as well to give a very strong signal.

If you had entered a short position at the close of the 3 PM candle (at 4 PM) at 69.927, you would have watched it move against you initially, but then fall as low as 68.98, approximately 95 points in profit, before bouncing back slightly towards the end of the day.

Since then it has continued moving higher in the overnight Asian session, but that doesn’t really matter. It still gave you enough of a move to bank some nice profits, even if you closed half the position at 50 points and were stopped out at break-even with the other half, for example.

Final Thoughts

Hopefully I have now demonstrated that this multi-timeframe strategy works well on a variety of different instruments because I have now given trading examples of this strategy for oil, gold and the USD/JPY pair.

You do still need to be selective, as I highlighted above, because you don’t want to take an entry signal at the quieter periods of the day. If you have strong volume on your side and are trading in alignment with the prevailing trend on the higher time frames, your odds of success will be much higher.

Filed Under: Analysis Tagged With: oil, us crude

Gold Multi-Timeframe Trade Example – 28 November 2023

November 30, 2023 by James Woolley Leave a Comment

Introduction

I was recently asked to provide a few more examples regarding the multi-timeframe strategy that I like to use to trade the forex and commodity markets, so in this article I want to break down a gold trade from earlier this week that was based on this strategy.

Just to reiterate what I said in the previous USD/JPY trade example, what you are looking for with this strategy is for a market to be trending strongly in the same direction on two or three different timeframes, and temporarily pulling back on a shorter time frame.

Then you want to wait for a strong signal that the longer term trade has resumed on this shorter time frame so that you can then jump in and take the trade with the underlying trend.

Although there will always be false price moves, the reality is that when four different timeframes are in alignment in terms of the overall trend, the odds of success are greatly enhanced.

Underlying Gold Trend

Diving straight into the trade breakdown of gold, if we take a look at the weekly, daily and 4-hour charts, we can see that the price was above my two preferred moving averages, the EMA(10) and EMA(20), on all three of these timeframes as we started the week:

Indeed it was actually above the EMA(50) and EMA(200) on all of these timeframes as well, which just underlines how strongly the price of gold has been trending upwards in recent times.

Waiting For a Pullback

The next step is to drop down to the 1-hour chart and wait for a pullback to the EMA(10) and EMA(20) moving averages. Ideally we want to see the price actually dropping below these moving averages before breaking upwards once again and starting a new upward leg on this lower timeframe.

As you can see from the chart below, the price did just this on Tuesday morning, and there was subsequently some very nice consolidation within a very tight band between the 10 and 20-period moving averages:

When this happens, there is often a strong breakout about to emerge, and in this case it was an upward breakout just before the US market opened later that day, which is exactly what we wanted to see because the trend was already bullish on the three higher timeframes mentioned earlier.

Then it is just a matter of entering a long position on the close of this strong breakout candle, which I have highlighted on the chart, or taking a chance that there will be a slight pullback after the close of the candle that will allow you to enter at a slightly better price.

Trade Outcome

If you entered at the close of the 1-hour breakout candle at $2021.56, you could have banked up to $21.53 profit because the price hit a high of $2043.09 later that afternoon, and actually hit a high of $2052 overnight.

So this demonstrates the effectiveness of this multi-timeframe strategy if you wait for a pullback on the shorter timeframe and then enter a position on a resumption of the underlying trend from the three higher timeframes.

Not every trade will work out of course, but if you always trade with the trend, you should hopefully win more times than you lose if you wait for the best entries.

Filed Under: Analysis Tagged With: gold, strategy, trend, trend trading

The Funded Trader’s Stats From August, September, October 2023

November 29, 2023 by James Woolley Leave a Comment

Introduction

It is always interesting when prop firms put out some statistics from all of their traders’ trading activity because you can instantly get an idea of which markets are currently the most profitable, and which are potentially worth avoiding.

One of the most popular prop firms right now is The Funded Trader, and they have just released their latest stats from August, September and October 2023, and as always, they make for some interesting reading.

Most Profitable Markets

According to their comprehensive statistical analysis, the most profitable market to trade during the last three months was the Nasdaq 100.

This will come as a surprise to many because a lot of people find this to be one of the most volatile markets to trade, and one of the most challenging.

This is a market that can move fast, and can easily whipsaw in both directions in a single trading session, and it hasn’t been an easy market for longer-term traders to trade either because it basically moved sideways for two months prior to its recent rally this month.

It was also a little surprising to see that the EUR/NZD pair was one of the most profitable pairs to trade too.

This is not a pair that many traders like to trade because the spread may be a little too high at around 2-3 points with some brokers, and it is not as actively followed as the EUR/GBP or the EUR/USD pairs, for example.

However with an average daily trading range of between 107 and 145 points during these three months, it does still offer a lot of profit potential for day traders, and so it is easy to see why some traders have made some decent returns trading it recently.

Least Profitable Markets

With regards to the least profitable markets, the two most challenging markets to trade during August, Septemnber and October 2023 were the Dow Jones (US30) and gold.

It is not necessarily surprising that gold was one of them because this has always been a widow maker kind of a market to trade. Gold has the potential to blow up your account in no time at all, with big price swings that can come out of nowhere.

It is more surprising that the Dow Jones was so unprofitable for many traders because this is generally regarded as being easier to trade than the Nasdaq 100, but the stats would suggest that the opposite was true this time around. Maybe this was just a one-off occurrence.

Average Pass Rates

The average pass rates were fairly high at 27% for phase 1, and 42% for phase 2. I think this is higher than many other prop firms because the overwhelming majority fail to get past phase 1 of their respective challenges.

It is natural for the phase 2 pass rate to be higher because if a trader has the ability to pass phase 1, they should find it easier to pass the less demanding profit level of phase 2.

Average Reward to Risk Ratio

The general advice is that you should always aim for a reward to risk of over 1 so that your potential gain is always greater then your potential loss, and these latest stats would bear this out.

The average reward to risk ratio was between 1 and 1.77 for those people who passed the phase 1 and phase 2 challenges, and the average reward to risk of those who didn’t pass was around 0.5.

Drawdown

According to these stats, 71% of people failed the challenges by hitting the daily drawdown and 29% failed by hitting the maximum drawdown.

This suggests that the majority of traders are taking quite large positions in an effort to pass the challenges quickly, and are not overly worried if they end up losing the challenge by taking this bold approach.

Indeed it was revealed that out of all the traders who passed the challenges and received a payout, most of these traders will have paid for seven challenges on average prior to getting to this point.

This just shows that it can get quite expensive chasing the dream of having a fully funded prop firm account, and it is definitely not as easy as the trading furus on X make it out to be.

Filed Under: Analysis Tagged With: funded trader, tft

  • 1
  • 2
  • 3
  • …
  • 17
  • Next Page »

Forex Rebates:

Choose from 40+ different forex brokers and crypto exchanges, and get cashback every time you trade:


Copy Profitable Traders:

If you join ZuluTrade, you can follow and subscribe to profitable traders and all of their trades will be automatically copied in your own trading account.

You can also earn money as a signal provider if you are already a profitable trader.

Click here to find out more

Recommended Broker:

Recent Blog Posts:

  • High Probability Trade on S&P 500 – 26 January 2024
  • Oanda Moves Into Prop Trading With Labs Trader Program
  • My eToro Performance in 2023 – Up 33.24%
  • The5ers Offering $20K Bootcamp Challenge For Just $1
  • Example of VWAP Bounce Trade on S&P 500 – 18 December 2023

Recent Articles:

VWAP Indicator
  • MA Sabres (LuxAlgo) Indicator
  • 10 Harsh Truths About Forex Trading
  • Best Websites for Monitoring Currency Strengths
  • Xmaster Formula Indicator for MT4 and MT5
  • Tools:

    Currency Heat Map

    Categories

    • Analysis
    • News

    Archives

    • January 2024
    • December 2023
    • November 2023
    • October 2023
    • September 2023
    • August 2023
    • July 2023
    • June 2023
    • May 2023
    • August 2020
    • June 2020
    • May 2020
    • April 2020
    • January 2020
    • December 2019
    • November 2019
    • October 2019
    • September 2019
    • August 2019
    • July 2019
    • June 2019
    • May 2019
    • April 2019
    • March 2019
    • February 2019
    • January 2019
    • December 2018
    • November 2018
    • October 2018
    • September 2018
    • August 2018
    • July 2018
    • June 2018
    • May 2018
    • March 2016
    • December 2015
    • November 2015
    • October 2015
    • August 2015
    • July 2015

    Disclaimer

    This website should be used for general information purposes only and in no way represents professional financial advice.

    Forex and CFD trading carries a high level of risk and it is possible to lose more than your initial deposit if using leveraged products.

    Copyright © 2025 · eleven40 Pro Theme on Genesis Framework · WordPress · Log in

    • About
    • Contact
    • Disclosure
    • Privacy Policy
    • Terms Of Service