The Forex Chronicles

  • Rebates
  • Brokers
  • News
  • Analysis
  • Signals
    • Best Copy / Social Trading Platforms
    • eToro Review
    • FXTM Invest Review
    • Marketclub Review
    • ZuluTrade Review
  • Indicators
  • Strategies
  • Articles

Gold Looking Overbought Around $1300

January 8, 2019 by James Woolley Leave a Comment

Previous Price Action

It is a long time since I talked about gold, but in my last post back in October, I highlighted the upwards price breakout that had just occurred on this particular commodity, and this proved to be a decisive breakout.

I remember saying at the time that I wasn’t really convinced about this specific breakout, but I turned out to be wrong because the price did indeed continue to creep higher in the following months.

This is primarily because people turn to safe havens in times of crisis, and November and December saw some of the biggest stock market falls on record.

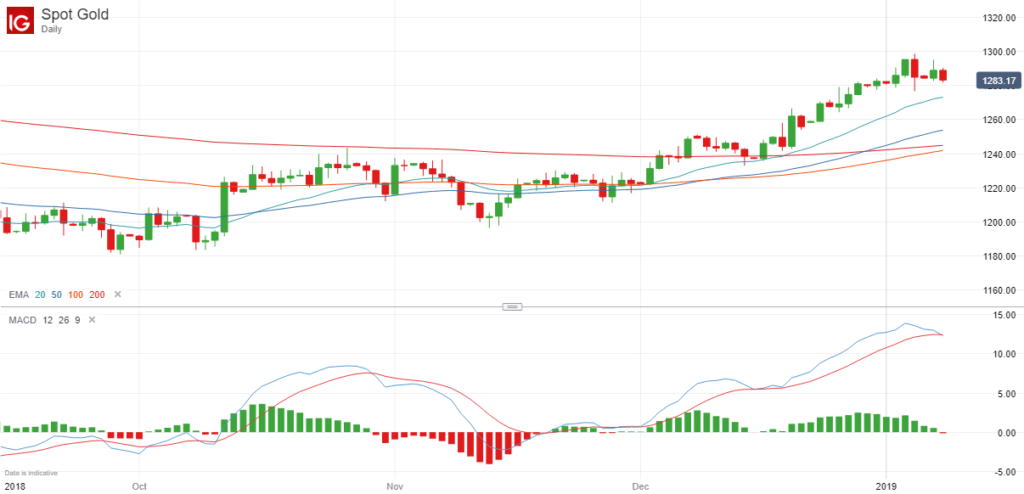
As a result, the price of gold currently stands at $1283 at the time of writing, having previously traded close to $1200 for long periods of time.

Future Price Move

The stock markets have actually bounced back in recent weeks, and as a result of this, people have been selling gold to buy stocks, pushing the price down slightly.

After trading close to the $1300 level, which is an important round number, and therefore a key resistance level that needs to be broken, it has since fallen back to $1283, as mentioned above.

However I still think there is a possible trading opportunity here.

Gold Price Chart - 8 January 2019

Trading Opportunity

It is still too early to predict where the stock markets are headed because a continuation of the downward trend could be just around the corner, but I still believe that the price of gold will struggle to break through the significant $1300 level.

Therefore it might be worth looking for a clear reversal signal on the daily chart of this particular market for additional confirmation.

If you look at the price chart above, you can see that we have just had a downward MACD crossover, which is often seen as quite a strong reversal signalby itself, but I personally would be looking to enter a short closer to $1300 if possible.

Ideally I would like to see a pin bar on the daily chart because if the price pushed up towards $1300 once again, but ran out of momentum a second time before breaking lower, this would be the perfect time to go short.

So at the moment we just have to wait and see if this particular scenario plays out, but as always, I want to point out that these are just my own thoughts and opinions. This doesn’t represent professional financial or trading advice in any way.

Filed Under: Analysis Tagged With: gold, gold price

US Crude Oil Update – 1 January 2019

January 1, 2019 by James Woolley Leave a Comment

Previous Breakout

A few weeks ago I highlighted a possible breakout that was shaping up on the daily chart of US crude oil, and as it turned out, this would have been a very profitable trade:

US Crude Oil Breakout - December 2018

After breaking out of the previous trading range and closing below the lower trendline, the price went from around $49.50 to as low as $42.44 in a relatively short period of time.

Inside Bars

Since then, the price has recovered somewhat and is now trading around the $45 – $46 level, having moved relatively little during this quiet Christmas and New Year period.

However it is interesting to note that an inside bar formation has formed on this same daily chart, which suggests that there may be a possible breakout in the next few days.

US Crude Oil Inside Bars - 1 January 2019

What I am basically saying is that after the large bullish candle on 26 December 2018, there have been 3 consecutive inside bars / candles (4 if you include the Sunday session) that have all traded within the range of this particular candle.

Trading Opportunity

This is often a very good set-up if you are looking to trade breakouts because traders will often spot the same breakout themselves and pile into a position once the price closes above or below the initial set-up candle, helping it to become a self-fulfilling breakout for everyone.

In this case, an upward breakout is looking more likely simply because it is trading closer to the high of the initial candle, and we are long overdue a bounce as the price of oil dropped so much last year.

Therefore if the price closes above $47.08 in the coming days without closing too far above this level, this could be a good opportunity to open a long position.

$50 would be an obvious resistance level, so it might be a good idea to target an exit price just below $50, but if it could break through this level, then the price could potentially surge towards the 100 and 200-day EMAs, which are currently at $57.76 and $61.26 respectively.

I personally think the first outcome is more likely because I think it will struggle to break through the $50 at the current time.

If the price doesn’t close above the high of the initial candle and instead breaks below the low of this candle, and indeed the low of the previous candle a few days earlier, then this will really open up the downside.

This would see the price drop to around $42, and if it closed around this level, you could then expect the price to fall below $40 fairly easily.

However at the moment we just have to wait and see what happens. What I will say is that the longer the price trades within the range of the initial set-up candle, the stronger the breakout is likely to be.

As always, please note that these are just my own thoughts and opinions. This doesn’t represent professional trading or financial advice in any way.

Filed Under: Analysis Tagged With: breakout, oil, us crude

Dow Jones Analysis – Positive Divergence Hints at Santa Rally

December 19, 2018 by James Woolley Leave a Comment

December Price Falls

December is usually quite a good month for stock market traders and investors, but this has apparently been the 2nd worst December on record.

The leading stock market indices have all fallen sharply and there are many reasons why. Brexit, interest rate rises, trade tariffs and the threat of a possible recession have all weighed heavily on the indexes this month.

As a result of this, many people have given up on the idea that there will be a Santa rally this year, but looking at the 4-hour chart of the Dow Jones, there is still hope:

Dow Jones Positive Divergence - December 2018

Positive Divergence

As you can see, the price has recently been posting new lows, but if you look at three of the leading technical indicators, you will notice that there has been positive divergence on each of these indicators.

In other words, as the price has posted new lows, the CCI, RSI and Stochastics indicators have all failed to post new lows, and have actually been trading higher, which suggests that the downward move is running out of momentum.

Future Price Move

This positive divergence suggests that the price is likely to move higher in the coming days, but it should always be emphasized that these are all just indicators. The price could easily turn lower and start a new downward wave.

However with just 4 trading sessions left before Christmas, my own view is that we will still see a Santa rally this year, which could then continue until the New Year, as it so often does.

Therefore a price of 24,000 would be my first target, which should easily be achieved if there is such a rally, and looking further ahead, I wouldn’t be surprised it the price went back to the EMA (100) on this time frame, which is currently around 24,500. This would result in a rise of around 3% from the current price level.

As always, these are just my own thoughts and predictions. This in no way represents professional trading or financial advice. You should always do your own research before entering any positions in the markets.

Filed Under: Analysis Tagged With: divergence, dow jones, santa rally

Possible Breakout on US Crude Oil – December 2018

December 17, 2018 by James Woolley Leave a Comment

Recent Price Action

The price of US crude oil has been trading in quite a narrow sideways trading range in recent times, and seems to have stabilized between $50 and $55 with no clear direction.

However if you draw some trendlines on the daily chart of this particular commodity, you can see that the range is getting smaller all the time, and therefore a breakout is becoming increasingly likely:

US Crude Oil Daily Chart - December 2018

Downward Breakout?

At the time of writing this article, the price has actually dipped below the lower trendline ever so slightly, hinting at a possible breakout, however it is still too early to call.

That’s because you really need to wait for the price to close decisively outside of an established trading range before trading breakouts.

So in this instance we will need to wait until the candle closes at the end of the trading session before seeing if this is an actual breakout or not.

I think it is fair to say that most traders are actually expecting the price of crude oil to bounce back rather than break lower because 89% of traders have long positions on eToro, and 87% of traders have long positions on IG Index, for example.

Therefore it will be interesting to see what happens in the coming hours and days.

Possible Price Targets

If the price does indeed break decisively below the lower trendline, then it could easily fall below $50 to around $48, and possibly as low as $45, although it is very hard to set any price targets with any real accuracy right now.

The fact that we are entering a quiet period of the year for the markets, ie Christmas and New Year, means that volumes are a lot lower, and as a result of this, price moves are harder to forecast because any price swings that occur can either be exaggerated or thwarted by low volumes.

I personally would be a lot more confident about trading an upward breakout because the price has already fallen quite substantially since the start of October. Therefore I would look for the price to close around the $53 level or higher before considering opening a long position, as so many traders are predicting.

However these are just my own thoughts and opinions. This in no way represents financial or trading advice of any kind.

I just thought I would alert you to a possible breakout that could be about to take place on US crude oil as we head into Christmas.

Filed Under: Analysis Tagged With: breakout, oil, us crude

Possible Inside Bar Breakout On GBP/JPY Pair – 29 November 2018

November 29, 2018 by James Woolley Leave a Comment

Introduction

The GBP pairs have been almost impossible to trade just recently because of the ongoing uncertainties surrounding Brexit, which is why it is sometimes a good idea to just wait for a breakout from an established trading range.

Therefore with that in mind, it may be worth taking a look at the GBP/JPY pair right now because there has recently been a series of four consecutive inside bars (five if you include Sunday’s trading session).

So in other words, after the large candlestick from last Thursday, the price has traded within the range of this candle every day since then, as you can see in the chart below:

GBPJPY Inside Bars - 29 November 2018

Why is This Significant?

These inside bars highlight a period of uncertainty because the price has failed to break above or below the respective high and low of this candle since then.

In addition, you will also notice that the EMAs that I like to use (20, 50, 100 and 200) are all closely bunched together, which often occurs before a breakout.

Therefore when the price does eventually break above or below this initial candle from last Thursday, there may well be a decent breakout.

Trading Opportunity

With four consecutive inside bars, the likelihood of a major breakout continues to grow, so it might be a good strategy to enter a long order a few pips above the high of the initial candle (14595.9), and enter a short order a few pips below the low of this candle (14426.5) in case there is a downward breakout.

There is the potential for the price to break through the EMA (200) if there is an upwards breakout, and this may be a good place to close half the position, while the price could test the recent lows at around 142.50 if there is a downward breakout.

However, as always, I am not offering any trading advice and am not recommending any trades. These are just my own personal views and observations.

Filed Under: Analysis Tagged With: breakout, gbpjpy, inside bar

  • « Previous Page
  • 1
  • …
  • 8
  • 9
  • 10
  • 11
  • 12
  • …
  • 17
  • Next Page »

Forex Rebates:

Choose from 40+ different forex brokers and crypto exchanges, and get cashback every time you trade:


Copy Profitable Traders:

If you join ZuluTrade, you can follow and subscribe to profitable traders and all of their trades will be automatically copied in your own trading account.

You can also earn money as a signal provider if you are already a profitable trader.

Click here to find out more

Recommended Broker:

Recent Blog Posts:

  • High Probability Trade on S&P 500 – 26 January 2024
  • Oanda Moves Into Prop Trading With Labs Trader Program
  • My eToro Performance in 2023 – Up 33.24%
  • The5ers Offering $20K Bootcamp Challenge For Just $1
  • Example of VWAP Bounce Trade on S&P 500 – 18 December 2023

Recent Articles:

VWAP Indicator
  • MA Sabres (LuxAlgo) Indicator
  • 10 Harsh Truths About Forex Trading
  • Best Websites for Monitoring Currency Strengths
  • Xmaster Formula Indicator for MT4 and MT5
  • Tools:

    Currency Heat Map

    Categories

    • Analysis
    • News

    Archives

    • January 2024
    • December 2023
    • November 2023
    • October 2023
    • September 2023
    • August 2023
    • July 2023
    • June 2023
    • May 2023
    • August 2020
    • June 2020
    • May 2020
    • April 2020
    • January 2020
    • December 2019
    • November 2019
    • October 2019
    • September 2019
    • August 2019
    • July 2019
    • June 2019
    • May 2019
    • April 2019
    • March 2019
    • February 2019
    • January 2019
    • December 2018
    • November 2018
    • October 2018
    • September 2018
    • August 2018
    • July 2018
    • June 2018
    • May 2018
    • March 2016
    • December 2015
    • November 2015
    • October 2015
    • August 2015
    • July 2015

    Disclaimer

    This website should be used for general information purposes only and in no way represents professional financial advice.

    Forex and CFD trading carries a high level of risk and it is possible to lose more than your initial deposit if using leveraged products.

    Copyright © 2025 · eleven40 Pro Theme on Genesis Framework · WordPress · Log in

    • About
    • Contact
    • Disclosure
    • Privacy Policy
    • Terms Of Service