The Forex Chronicles

  • Rebates
  • Brokers
  • News
  • Analysis
  • Signals
    • Best Copy / Social Trading Platforms
    • eToro Review
    • FXTM Invest Review
    • Marketclub Review
    • ZuluTrade Review
  • Indicators
  • Strategies
  • Articles

Gold Continues To Trade In Narrow Range Around $1200

September 25, 2018 by James Woolley Leave a Comment

Death Cross

If you are a regular reader of this site, you will know that I recently posted about the death cross that has just occurred on the weekly chart of gold.

This is basically where the 50-period moving average crosses below the 200-period moving average, and is generally considered to be a very bearish signal.

Since then the death cross has been confirmed, but it hasn’t resulted in a wave of sellers using this as an opportunity to drive the price lower.

This is not unexpected because these weekly signals can take a long time to unwind, but if you drop down to the daily chart, you will see that the price is really struggling for direction right now.

Narrow Trading Range

In recent weeks the price seems to have been glued to the critical $1200 level, and has struggled to break decisively above or below this significant round number with any real momentum or conviction, as you can see below:

Gold Narrow Trading Range - September 2018

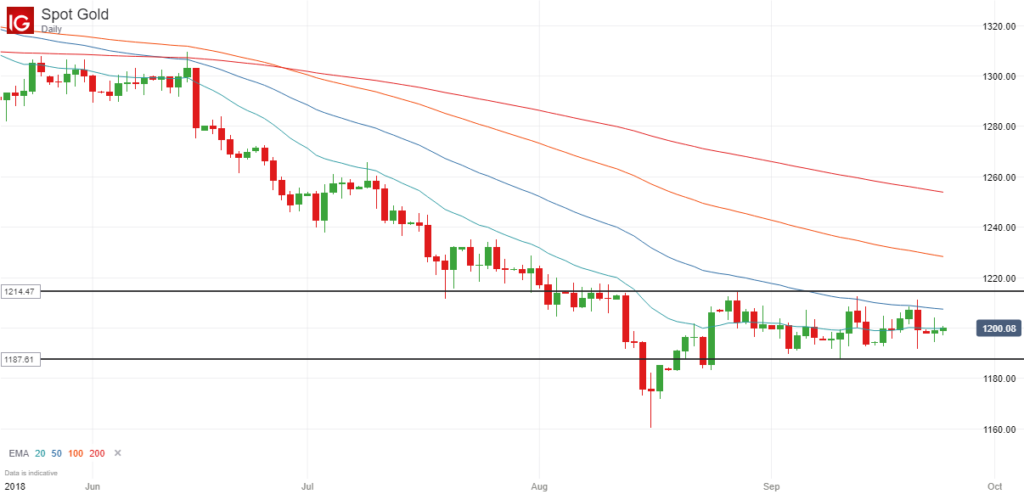
So far this month it has recorded a low of $1187.8 and a high of $1214.4, but has remained in a very narrow trading range for several weeks now.

Inside Bar

In addition to trading in a very narrow range, we have also had a series of three consecutive inside bars in the last three trading sessions (if you include the Sunday session), which is always worth noting because these inside bar patterns will often present you with a profitable breakout opportunity when the price closes above or below the initial set-up bar.

Trading Opportunity

From a trading perspective, it is very hard to trade any instrument that is basically trading sideways with no clear direction, but it is still good to see such a pattern because it usually leads to a profitable set-up when the price eventually breaks out of this range.

This is particularly true when you have a series of inside bars within this sideways trading range, as is the case here.

Therefore it might be worth watching the price of gold in the coming weeks because there could be a strong price move when the price closes above or below both the set-up bar and the previous high or low of this trading range.

A downward break would arguably be preferable because we have already seen a death cross on the weekly chart, and there could subsequently be a lot of downside potential.

Nevertheless, an upward price breakout could still be worth trading because there is always the potential for the price to move back towards the 200-day exponential moving average or the 100-day exponential moving average, which currently stand at $1253.9 and $1228.3 respectively, before heading south once again.

The point is that these sideways trading ranges and inside bar formations can be very profitable to trade because in many cases the longer it remains in the range, and the longer the price trades within the initial set-up bar, the bigger the breakout once the price closes outside of this range.

To demonstrate this point, you only have to check out these two inside bar range breakouts that occurred on Bitcoin and the GBP/JPY pair last month.

Filed Under: Analysis Tagged With: breakout, gold, inside bar

AUD/USD Continues Trading In Range After False Breakout

September 24, 2018 by James Woolley Leave a Comment

Price Action in 2018

The AUD/USD hit a peak of 0.8136 back in January this year, but since then it has been in a fairly steady and consistent downward trend throughout 2018.

Indeed at the time of writing, the price of this particular currency pair is trading at 0.7273, which shows just how strong the American dollar has been this year.

AUDUSD Price Chart 2018

By drawing trendlines connecting the highs and the lows, you can see that the price has been consistently sold off at the top of the channel, and bought up each time it has traded near the bottom of the channel.

However the price did actually close strongly below this lower trendline earlier this month, suggesting that there was enough momentum to take it a low lower, but this didn’t actually turn out to be case.

False Breakout

This false breakout raises two interesting points about price action trading. First of all, not all price breakouts turn out to be profitable. Even if you have a clearly defined channel or trading range, it doesn’t necessarily follow that the price will move strongly upwards or downwards once it closes outside this range.

Secondly, it reconfirms the point that you need to be careful trading continuation patterns when the trend has already been in place for a long time already (approximately 8 months in this case). Yes there is a chance that there will be another wave downwards, but there is also a strong chance that there won’t be enough momentum to take it much lower.

With long downward trends such as this one, there is arguably more profit to be made from trading an upward price breakout because this would signify that the downward trend is over, and a new upward trend is emerging, in which case there is a lot of upside potential because it could easily move 2 or 3 times the range of the current channel.

Trading Opportunities Going Forward

At this moment in time, I wouldn’t feel comfortable going long at the bottom of the channel and going short at the top of the channel because I feel that we are due a breakout very soon.

Furthermore, I wouldn’t really want to be opening any short positions on the AUD/USD pair even if the price closed below the lower trendline once again because I’m not really confident that this pair has the potential to fall much lower.

Therefore I personally would only consider opening a long position right now, and only when the price closes strongly above the upper trendline.

If it did so, I would probably look to close half the position at the EMA (200), which is approximately 1 x the range of the channel, before moving my stop loss up to break-even and targeting 2 x the range of the channel with the second half of the position, which would give a target price of approximately 0.7700, just short of the 61.8% fibonacci retracement level.

However these are just my own personal views and in now way represents trading advice.

Filed Under: Analysis Tagged With: audusd, breakout, range trading

Brent Crude Still Struggling To Break $80

September 22, 2018 by James Woolley Leave a Comment

September Price Action

It has been very interesting to watch the price of Brent Crude this month because it has been getting very close to the $80 level without actually breaking through this key level.

I said before that $80 is acting as strong resistance, and the third significant doji candle from yesterday provides further evidence that the market just doesn’t want to see the price go higher than $80.

In that particular trading session, the price reached a high of $79.69 before being driven back down to a low of $77.81. It then closed the day close to it’s opening price at $78.23, which is why we have another doji candle.

Brent Crude Doji And Divergence

The Significance of Doji Candles

These doji candles generally indicate indecision in the markets, but when they occur at a possible high or low of a trading range and are close to key levels of support and resistance, they often provide good reversal signals, and that seems to be the case here.

Every time there has been a doji candle forming after a flirtation with the $80 level, the price has subsequently dropped and there has been a good opportunity to trade the downward breakout, ie when the price drops below the low of the doji candle the following day.

On each occasion the price has dropped enough to generate a decent profit before resuming it’s gradual upward trend once again, but there are signs that this upward trend is starting to run out of momentum.

RSI and Stochastic Divergence

As you can see from the daily chart of Brent Crude above, the price keeps on creeping higher, as indicated by the rising exponential moving averages, but the RSI and stochastic indicators are struggling to make new highs. In fact the peaks are actually getting lower each time.

So there is clear divergence on both of these indicators, which suggests that momentum is running out and as a result of this, there could be a significant reversal just around the corner. Therefore the 200-day exponential moving average, which currently stands at $72.51, may be a realistic target.

Trading Ideas

I will be watching the price of Brent Crude very closely when the markets open on Monday because it will be interesting to see where the price goes from here. There are potentially two scenarios that could create a high probability set-up:

  • The price drops below the low of the doji candle ($77.81), in which case it may be worth opening a short position a few pips below this level.
  • There is an inside bar whereby the trading range of the entire day (and maybe a few subsequent days) falls within the high and low of the doji, in which case it might be an idea to watch and wait until the price breaks below the low of the doji candle for an opportunity to go short.

If the price goes higher and breaks above the high of the doji candle, then it may finally breach the $80 level, in which case it might be worth opening a long position or forgetting about opening any trades altogether.

With divergence on the RSI and stochastic indicators, as well as a nice doji candle near the $80 level, a short position is looking a lot more appealing at the present time.

As always, I just want to point out that these are just my own thoughts and opinions. I am not recommending any trades whatsoever. You should always do your own research and make your own decisions when trading the financial markets.

Filed Under: Analysis Tagged With: brent crude, divergence, doji

Potential Downward Breakout on AUD/NZD Pair Below 1.0870

September 17, 2018 by James Woolley Leave a Comment

AUD/NZD Price Action

The AUD/NZD pair is one that is not widely traded or followed by British, American and European traders (who make up the majority of my readers), but it is still one that is worth watching because it can throw up some decent trading opportunities from time to time.

Having not looked at this pair for several days, I have just been looking at the recent price action, and it would appear that this pair has been slowly trending upwards in an ascending triangle pattern.

However in recent days it has been trading close to the lower trend line and is starting to show a little weakness with no real momentum to push higher.

Furthermore, the EMAs that I like to use, namely the 20, 50, 100 and 200-period exponential moving averages, are now very close to one another, which is exactly what we want to see before a big breakout.

AUDNZD Ascending Channel And EMA Breakout

Trading Opportunity

There is always the chance that the upward trend will continue and the price will move back up towards the upper trendline, but if the price does actually fall below 1.0870, it represents a much better trading opportunity in my opinion.

A downward break of the trendline, combined with an EMA breakout would be a good example of a high probability set-up and one that might be worth trading.

This is particularly true when you consider that if the price does fall below this lower trendline, it should close below the EMA (200), which the markets always pay close attention to, and will often act upon accordingly.

(Please note I am not recommending any trades. These are just my own personal thoughts and opinions).

Regarding price targets, you would have to say that if this scenario does play out, then the price of the AUD/NZD pair could easily fall to 1.0600, and if the 20, 50 and 100-period EMAs cross below the EMA (200), there could be enough momentum for the price to go a lot lower than this in the coming weeks and months.

With channel breakouts, you always want as many factors in your favour as possible, and in this case you will have the added weight of the EMAs breaking out of their consolidation and a downward cross of the EMA (200) if the price does indeed break out of its ascending channel and close below 1.0870. So this is potentially a decent set-up for anyone who is looking to take a position on this pair.

Filed Under: Analysis Tagged With: ascending channel, audnzd, breakout

$80 Acting As Strong Resistance For Brent Crude Oil

September 14, 2018 by James Woolley Leave a Comment

Brent Crude Price Action (2016-2018)

The price of Brent Crude dropped below $30 back in 2016, resulting in sharp share price falls for all of the listed oil companies.

Since then the price of Brent oil has risen steadily over time, and although it is nowhere near its all-time highs, it now stands at $78.18, which is a very strong recovery. As you might expect, the share price of all of the major oil companies has risen sharply as a result, and many oil traders have made some decent profits as well.

Recent Price Action

From a trading perspective, the long-term history of the Brent Crude oil price doesn’t matter too much, but if you look at how this commodity has traded in 2018, the price action is a lot more significant and could affect how you trade in the future.

That’s because it is clear that $8000 has acted as strong resistance on several occasions since May, and continues to act as resistance even now in September 2018.

Brent Crude Oil Chart - September 2018

Just a few days ago the price hit a high of $79.89, but was quickly sold off shortly afterwards, and the daily candle ended up being a doji candle, which indicates indecision and a lack of momentum to take it higher.

Subsequently when the price dropped below the low of this doji candle the following day, this was a good opportunity to open a short position and trade the downward breakout.

Furthermore, on the rare occasions that the price has risen above $80, it has never actually closed above this level at any point.

The Significance of $80

Before I discuss possible trading opportunities, I just want to discuss the significance of round numbers once again.

There are some traders who don’t believe that these round numbers carry much weight, but in my experience these numbers are highly important and will often act as a strong support or resistance level.

As a result of this, you will often see the price reverse at these key levels, and this certainly seems to be the case here because this commodity is quickly sold off any time it gets close to this critical $80 level.

Trading Opportunities

One obvious way to trade this reoccurring trading pattern is to simply enter short positions at $80 or just below, such as $79.50 or $79.75, for example.

However I don’t necessarily like this plan because at some point the price is likely to break through this $80 level (and close above this level), which will encourage traders to go long and push the price higher, and trigger your stop loss.

A better approach is to pay attention to the candlesticks that form and try and trade the price action. For example, if there is a doji bar, like there was yesterday, you can enter short positions if the price drops below the low of this candle because this is a high probability trade that will often generate decent returns, particularly if you close half the position early for 30-50 points, for instance, move your stop loss to break even and let the other half run for as long as possible.

Similarly, if there is a large candlestick when the price gets close to $80, followed by at least two or three inside bars, you could wait for the price to close below the initial set-up bar before entering a new short position because this will signify that there is a downward breakout.

The point is that you should pay attention to these key levels of support and resistance because the markets will pay close attention to them and trade accordingly. Therefore the resulting price reversals can be both predictable and profitable to trade if you get the right set-ups.

Filed Under: Analysis Tagged With: brent crude, brent crude oil, resistance

  • « Previous Page
  • 1
  • …
  • 11
  • 12
  • 13
  • 14
  • 15
  • …
  • 17
  • Next Page »

Forex Rebates:

Choose from 40+ different forex brokers and crypto exchanges, and get cashback every time you trade:


Copy Profitable Traders:

If you join ZuluTrade, you can follow and subscribe to profitable traders and all of their trades will be automatically copied in your own trading account.

You can also earn money as a signal provider if you are already a profitable trader.

Click here to find out more

Recommended Broker:

Recent Blog Posts:

  • High Probability Trade on S&P 500 – 26 January 2024
  • Oanda Moves Into Prop Trading With Labs Trader Program
  • My eToro Performance in 2023 – Up 33.24%
  • The5ers Offering $20K Bootcamp Challenge For Just $1
  • Example of VWAP Bounce Trade on S&P 500 – 18 December 2023

Recent Articles:

VWAP Indicator
  • MA Sabres (LuxAlgo) Indicator
  • 10 Harsh Truths About Forex Trading
  • Best Websites for Monitoring Currency Strengths
  • Xmaster Formula Indicator for MT4 and MT5
  • Tools:

    Currency Heat Map

    Categories

    • Analysis
    • News

    Archives

    • January 2024
    • December 2023
    • November 2023
    • October 2023
    • September 2023
    • August 2023
    • July 2023
    • June 2023
    • May 2023
    • August 2020
    • June 2020
    • May 2020
    • April 2020
    • January 2020
    • December 2019
    • November 2019
    • October 2019
    • September 2019
    • August 2019
    • July 2019
    • June 2019
    • May 2019
    • April 2019
    • March 2019
    • February 2019
    • January 2019
    • December 2018
    • November 2018
    • October 2018
    • September 2018
    • August 2018
    • July 2018
    • June 2018
    • May 2018
    • March 2016
    • December 2015
    • November 2015
    • October 2015
    • August 2015
    • July 2015

    Disclaimer

    This website should be used for general information purposes only and in no way represents professional financial advice.

    Forex and CFD trading carries a high level of risk and it is possible to lose more than your initial deposit if using leveraged products.

    Copyright © 2025 · eleven40 Pro Theme on Genesis Framework · WordPress · Log in

    • About
    • Contact
    • Disclosure
    • Privacy Policy
    • Terms Of Service