The Forex Chronicles

  • Rebates
  • Brokers
  • News
  • Analysis
  • Signals
    • Best Copy / Social Trading Platforms
    • eToro Review
    • FXTM Invest Review
    • Marketclub Review
    • ZuluTrade Review
  • Indicators
  • Strategies
  • Articles

Death Cross on Gold (Weekly Chart)

September 13, 2018 by James Woolley Leave a Comment

What is a Death Cross?

A death cross occurs when a short-term moving average crosses below a long-term moving average, and is significant because it often signals the start of a new long-term bearish trend.

Traders will often use different time periods and different moving averages to find these downward crossovers, such as the 50 and 100-period simple moving averages (SMAs), for example, but 50 and 200-period exponential moving averages (EMAs) seem to be the most popular.

As always, these crossovers are more significant on the longer time frames, such as the daily and weekly time frames, and for that reason I want to alert you to a new death cross that is occurring right now on the weekly gold chart based on the EMA (50) and EMA (200).

Previous Price Action

Gold traders may already be aware of the death cross that has occurred on the daily chart of this particular commodity during the summer. If not, here is the daily price chart that highlights this downward moving average crossover:

Gold Death Cross - Daily Chart

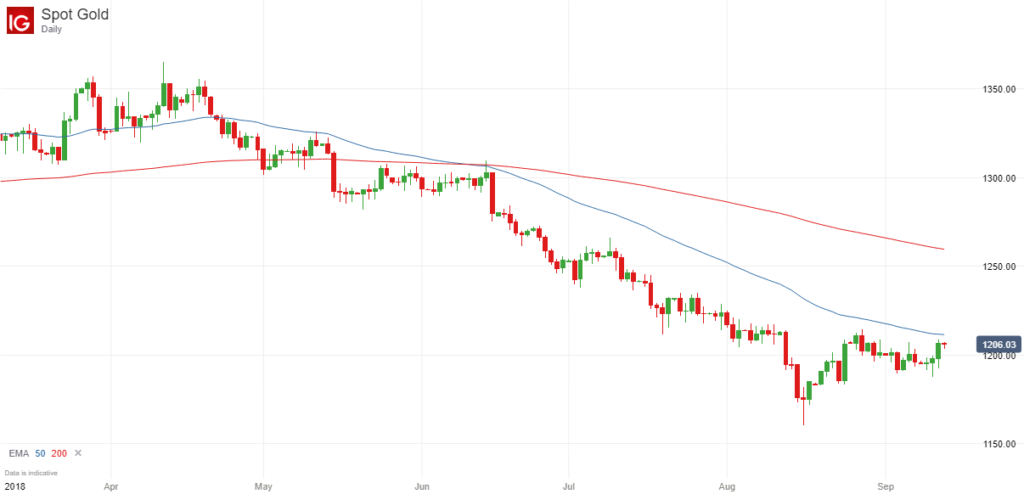
You can see that the death cross occurred during June and resulted in sustained price falls during the following months as traders continued to close long positions, sell gold and actively short this commodity, helping to drive the price down from around $1300 per ounce to just $1160 per ounce.

Since then the price has bounced back to the $1200 level and seems to have found support around this level, but ultra long-term traders may be interested to know that there is a new death cross forming on the weekly chart, which suggests that the price could still go a lot lower.

New Death Cross on Weekly Price Chart

If you look at the weekly price chart of gold, you can see that the 50-week exponential moving average is crossing below the 200-week exponential moving average.

Gold Death Cross - Weekly Chart

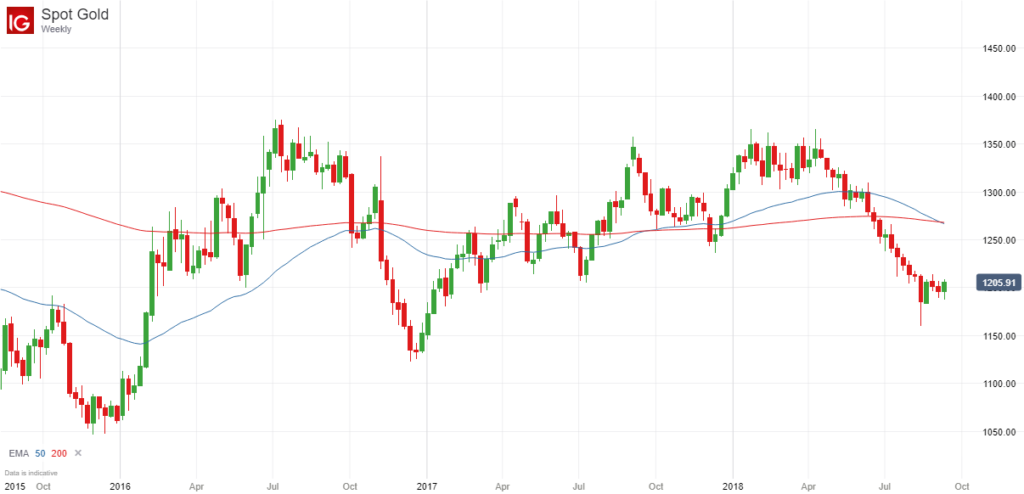
This in itself doesn’t necessarily guarantee that the price will drop a lot further in the short-term. It may well rebound in the next few weeks and come back to the EMA (200) because the price has already fallen heavily in recent months.

However the long term implications of this death cross could be significant because in the past these crossovers have resulted in some long and sustained price moves, both to the upside (in the case of a golden cross) and the downside.

Therefore it could be argued that the price of gold could potentially fall to $1000 or lower in the coming months if traders act upon this weekly death cross and continue to drive the price lower.

So it will be interesting to watch the price of gold over the course of the next few years to see if this is a significant death cross or whether the price continues to trade in a sideways range.

Trading Opportunities

I wouldn’t necessarily recommend that you actively trade these death crosses, particularly on the weekly time frame. Nevertheless they do present opportunities because you can take note of this long-term trend and look to open short positions on any pull-backs.

For example, when the death cross is in force on the weekly chart, you might want to wait for pull-backs on the daily price chart and look for opportunities to open short positions where appropriate (downward breakouts from peaks, heavily overbought conditions, strong resistance at round numbers etc).

(If you would like to trade gold, AAAFX and Ayondo are two brokers that generally offer low spreads on this commodity).

Filed Under: Analysis Tagged With: death cross, gold, gold price

Another Bitcoin Inside Bar Breakout For September 2018?

September 11, 2018 by James Woolley Leave a Comment

Previous Price Action

If you visit this site regularly, you will know from a previous post that there was a decent inside bar breakout that occurred on Bitcoin last month.

After trading in a sideways trading range for a considerable amount of time, there was an inside bar trading pattern whereby the price continued to trade within the range of the initial bar for several days, which reinforced my belief that it was only a matter of time before we saw a decent breakout, and that’s exactly what happened.

Bitcoin Inside Bar Breakout - August 2018

As I said previously, it wasn’t a perfect set-up because of the bearish breakout bar, but nevertheless you still could have generated up to 700 points profit by entering a long position at the closing price of the breakout candle.

Inside Bar Breakout Part II

If you take a look at the right hand side of the chart below to view the very latest price action, you will notice that history appears to be repeating itself.

Bitcoin Inside Bar - September 2018

After surging upwards to a high of around $7400, the price of Bitcoin has since fallen sharply and is now trading within the range of the previous inside bar.

Furthermore, we now have a new inside bar set-up because at the time of writing, the price has been trading within the range of the initial bar for the last three days.

The set-up bars are indicated by the arrows in the chart above, and you can see that the following bars / candles are all inside bars, which is often a great set-up for a significant breakout.

Trading Opportunity

As a result of this, it may be worth watching the price of this popular cryptocurrency to see if there is a good opportunity to enter a new long or short position (depending on the direction of the breakout) in the coming days.

It may be profitable to simply enter a trade when the price breaks out of the range of the initial set-up bar (and closes outside of this range), but I personally would like to see the breakout bar close outside of the range of the previous inside bar trading range as well because I think this range still carries a lot of weight and is highly significant.

Anyway I just thought I would share with you this latest inside bar set-up because the subsequent breakouts that occur can be very profitable. As always, this is not a recommendation to trade, it is just my own personal thoughts and opinions. Please be aware that cryptocurrency trading is very risky, and there is the potential to lose a lot of money.

Filed Under: Analysis Tagged With: bitcoin, breakout, inside bar

Possible EMA Channel Breakout On USD/JPY – September 2018

September 10, 2018 by James Woolley Leave a Comment

Introduction

The USD/JPY has not been the easiest pair to trade over the summer months because it has been trading in a fairly constant sideways trading range with little volatility.

Indeed the average true range is currently around 52 points per day, which is a major drop when you consider that its average daily trading range was around 90 points per day back in February.

Nevertheless the recent price action suggests that there could be a decent trading opportunity just around the corner for this particular pair.

Pre-Breakout Trading Conditions

The best breakout trades often occur when the short and long-term exponential moving averages are all very close together, and the price is trading in an ever decreasing channel, and that’s exactly what we have with the USD/JPY pair right now, as you can see from the daily chart of this pair:

USDJPY Price Chart - 10 September 2018

The channel is clearly indicated by the two trendlines, and you can see that the 20, 50, 100 and 200-day exponential moving averages are all close together as well.

This indicates a period of consolidation and indecision, but more importantly, it suggests that there could be a significant breakout very shortly.

Trading Opportunity

The price is currently trading right in the middle of this channel at around 111.00, so there isn’t an opportunity to open a position right now.

However it may be worth opening a long or a short position if the price breaks decisively out of this channel (and closes outside of this channel), at which point the price will be around 112.00 or 110.00.

As ever, there are no guarantees of success, even with the best-looking set-ups, and I am certainly not recommending any possible trades. These are just my own personal thoughts.

However what I will say is that forex trading is all about finding high probability set-ups and managing your risk so that you come out ahead over time, and this could well be a high probability trading opportunity if the trading conditions are right and the breakout appears to be a decisive one with a strong breakout candle.

Filed Under: Analysis Tagged With: breakout, channel, usdjpy

Inside Bar Breakouts On GBP/JPY And Bitcoin From Last Month

September 5, 2018 by James Woolley Leave a Comment

Introduction

As I have mentioned previously on this site, inside bar breakouts are some of the my favorite trading patterns to trade because they will often yield some excellent profits.

This is particularly true when these inside bar breakouts come towards the end of a trend because they often provide solid confirmation that a reversal is taking place.

So with that in mind, I thought I would share you two profitable inside bar breakouts that occurred last month, ie August 2018, to give you an idea of how you can potentially trade these breakouts in the future.

Bitcoin Inside Bar Breakout

The first breakout is one that I have already discussed already in a previous blog post. On this occasion I actually discussed an inside bar breakout opportunity before it occurred, when I highlighted Bitcoin’s narrow trading range.

As you can see from the chart below, the price was trading sideways for long periods of time with no clear direction, with all the inside bar candles trading within the range of the initial bar.

Bitcoin Price Chart - August 2018

This is always a good set-up for a potential breakout, and this is what subsequently happened:

Bitcoin Inside Bar Breakout - August 2018

From a trading perspective, this wasn’t a perfect set-up because the breakout candle wasn’t exactly a decisive one. It is always a better signal when the price breaks strongly upwards or downwards out of its narrow trading range, but nevertheless this is one that would still have yielded decent profits of nearly 700 points so far if you had entered at the closing price of the first breakout candle.

GBP/JPY Inside Bar Breakout

Another decent set-up from last month occurred on the daily chart of the GBP/JPY pair. This pair had fallen sharply, along with many of the other GBP pairs, and during a period of consolidation, several inside bars had started to form.

Therefore when the price closed above the initial candle, this was a good opportunity to open a new long position and trade the breakout and the reversal.

GBPJPY Inside Bar Breakout - August 2018

As you can see from the chart above, this had a much stronger breakout candle and would also have yielded some decent returns. With the momentum gathered from the positive Brexit news that was starting to emerge, the price moved around 250 points higher from the closing price of the breakout candle, and although it has since dropped back a little, it could still go higher.

Final Thoughts

It is worth mentioning that these inside bar breakouts don’t occur that often across all of the major currency pairs, but when they do occur, they can be very profitable when you get the right set-up.

I would also add that I would feel more confident trading a major currency pair, such as the GBP/JPY pair, for example, rather than a cryptocurrency such as Bitcoin simply because they are completely unregulated and have large spreads, and no-one really knows what could happen in the future. They could easily rise or fall thousands of dollars in a single day, and subsequently destroy your capital if you are not careful.

Filed Under: Analysis Tagged With: bitcoin, breakout, gbpjpy, inside bar

Possible Channel Breakout On EUR/GBP Pair For September 2018

September 1, 2018 by James Woolley Leave a Comment

Introduction

I have recently been discussing why the EUR/GBP is no longer an easy pair to trade, particularly from a day trading point of view.

I also highlighted the fact that this pair has been trading in quite a sideways trading range for a long period of time now, making it fairly difficult for long-term traders to trade as well.

All of the points raised in this article still hold true today, but that doesn’t mean that you still can’t make money trading this pair. There is still the potential to trade any breakouts when they occur, and to take advantage of any new trends that are emerging on the price chart of this pair.

Rising Channel

The EUR/GBP has indeed been trading in a sideways range if you look at the long-term price chart, but in recent months it has started to trend upwards and post new highs for 2018.

You will also notice that it has been trading within a rising channel if you draw some trendlines on the daily chart, and is now interesting to watch because the price is at a critical point at the moment.

EURGBP Rising Channel In 2018

After posting a yearly high of around 0.9099, the price of the EUR/GBP pair has dropped back nearly 150 points to just over 0.8950, thanks largely to positive news regarding Brexit boosting the British Pound, and is trading right at the bottom of this rising channel, even dipping below it at one point during yesterday’s trading session.

Trading Opportunities

I have to admit that the EUR/GBP isn’t the best pair to trade breakouts with because the resulting price movements can be quite small on occasions.

Nevertheless it might be worth watching to see if the price can close decisively below this channel for an opportunity to open a short position. It may also be worth waiting for a downward breakout followed by a retracement and then a secondary price move downwards for confirmation of a breakout, although you then run the risk of missing out altogether if there is no retracement at all, which can sometimes happen.

It all depends on where the price goes from here. This lower trendline may in fact act as support once again, and subsequently push the price back up to the upper trendline, making new highs in the process.

If it does so, there is strong resistance at the top of the trendline, and further resistance at 0.9300 if the price breaks through the upper trendline because this was the high of 2017, and is also a round number that has a lot of significance in the eyes of traders.

Filed Under: Analysis Tagged With: breakout, eurgbp, rising channel

  • « Previous Page
  • 1
  • …
  • 12
  • 13
  • 14
  • 15
  • 16
  • 17
  • Next Page »

Forex Rebates:

Choose from 40+ different forex brokers and crypto exchanges, and get cashback every time you trade:


Copy Profitable Traders:

If you join ZuluTrade, you can follow and subscribe to profitable traders and all of their trades will be automatically copied in your own trading account.

You can also earn money as a signal provider if you are already a profitable trader.

Click here to find out more

Recommended Broker:

Recent Blog Posts:

  • High Probability Trade on S&P 500 – 26 January 2024
  • Oanda Moves Into Prop Trading With Labs Trader Program
  • My eToro Performance in 2023 – Up 33.24%
  • The5ers Offering $20K Bootcamp Challenge For Just $1
  • Example of VWAP Bounce Trade on S&P 500 – 18 December 2023

Recent Articles:

VWAP Indicator
  • MA Sabres (LuxAlgo) Indicator
  • 10 Harsh Truths About Forex Trading
  • Best Websites for Monitoring Currency Strengths
  • Xmaster Formula Indicator for MT4 and MT5
  • Tools:

    Currency Heat Map

    Categories

    • Analysis
    • News

    Archives

    • January 2024
    • December 2023
    • November 2023
    • October 2023
    • September 2023
    • August 2023
    • July 2023
    • June 2023
    • May 2023
    • August 2020
    • June 2020
    • May 2020
    • April 2020
    • January 2020
    • December 2019
    • November 2019
    • October 2019
    • September 2019
    • August 2019
    • July 2019
    • June 2019
    • May 2019
    • April 2019
    • March 2019
    • February 2019
    • January 2019
    • December 2018
    • November 2018
    • October 2018
    • September 2018
    • August 2018
    • July 2018
    • June 2018
    • May 2018
    • March 2016
    • December 2015
    • November 2015
    • October 2015
    • August 2015
    • July 2015

    Disclaimer

    This website should be used for general information purposes only and in no way represents professional financial advice.

    Forex and CFD trading carries a high level of risk and it is possible to lose more than your initial deposit if using leveraged products.

    Copyright © 2025 · eleven40 Pro Theme on Genesis Framework · WordPress · Log in

    • About
    • Contact
    • Disclosure
    • Privacy Policy
    • Terms Of Service