The Forex Chronicles

  • Rebates
  • Brokers
  • News
  • Analysis
  • Signals
    • Best Copy / Social Trading Platforms
    • eToro Review
    • FXTM Invest Review
    • Marketclub Review
    • ZuluTrade Review
  • Indicators
  • Strategies
  • Articles

Bitcoin’s Lack Of Volatility Suggests A Breakout Could Be Imminent

June 8, 2018 by James Woolley Leave a Comment

Bitcoin’s Volatile Past

If you have ever purchased any Bitcoins, you will know that this particular cryptocurrency has been on a crazy ride so far.

Just 3 years ago today you could buy a single Bitcoin for just $222, which seemed really expensive at the time, but today it is worth a staggering $7620.

That’s only half the story as well because at one point Bitcoin experienced a surge in popularity as a result of widespread media exposure, and everyone seemed to be buying Bitcoin and jumping on the bandwagon.

This helped to push the price of Bitcoin to an all-time high of $19,783.06 as demand far outstripped supply, but it has since fallen by more than 60% from its highs.

So while many people will have made some huge life-changing gains, a lot of people who were late to the party are nursing some massive losses.

Lack of Volatility in Summer 2018

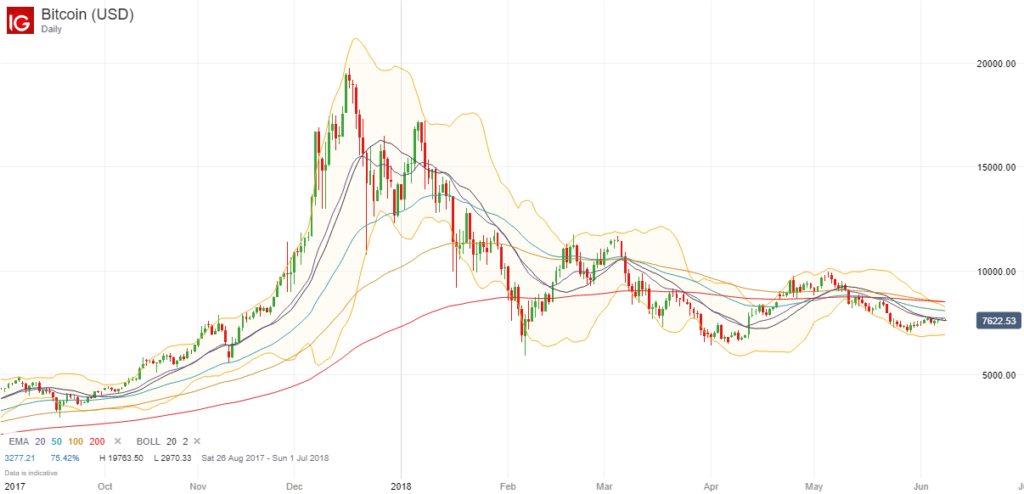
In the last month or so, the price of Bitcoin appears to have stabilized between 7000 and 8000, and is a lot less volatile than it used to be. The days of massive price swings appear to be over, at least for now.

This can be seen in the price chart below because you can see that the Bollinger Band indicator, which itself is a good indicator of volatility, is as narrow now as it has ever been, and all of the EMAs (exponential moving averages) that I like to use are all very close together, which also indicates a low volatility sideways trading range.

Bitcoin Price Chart 8 June 2018

Breakout Trading Opportunity?

It is extremely difficult to make money when an instrument is trading in a sideways trading range with no clear direction or momentum, but this is often the calm before the storm.

As soon as the price breaks out of one of these trading ranges with volume and momentum, it is often the start of a large breakout, either to the upside or downside, and therefore there is potentially a lot of money to be made by entering a position in the same direction as this breakout.

Of course there are no guarantees because you do sometimes see some false breakouts, but it will be interesting to watch the price of Bitcoin in the coming weeks.

If the price manages to move strongly upwards or downwards and smash through one of the outer Bollinger Bands, it could signal the start of a new trend, and therefore could represent a decent trading opportunity.

(Please note that this is just my own personal thoughts and ideas, and does not represent professional financial or trading advice in any way. You should always do your own research before trading Bitcoin or any other financial instrument.)

Filed Under: Analysis Tagged With: bitcoin, bitcoin chart, breakout

Average Daily Trading Range of the Major Forex Pairs in 2018

May 29, 2018 by James Woolley Leave a Comment

If you are looking to day trade the major currency pairs, it is imperative that you try to trade those pairs that have a decent amount of volatility.

That’s because you will generally find that it is so much easier to trade a pair that trades within a large trading range every day and makes strong moves upwards or downwards, rather than one that barely moves and has limited price swings.

So with that in mind, I want to take a look at the average daily trading range of all of the major forex pairs right now in May 2018 because this will give you an idea of which pairs are worth day trading (keep reading to view the latest figures for October 2018).

Here is the latest ATR (average true range) reading for all of these pairs, and for some of most popular indices, commodities and cryptocurrencies:

AUD/USD – 49
EUR/CHF – 67
EUR/GBP – 43
EUR/USD – 78
GBP/USD – 84
GBP/JPY – 123
USD/CAD – 76
USD/CHF – 48
USD/JPY – 63

FTSE 100 – 67
DOW JONES – 239
NASDAQ – 85
S&P 500 – 25
BRENT CRUDE – 140
CRUDE OIL – 129

BITCOIN – 379
BITCOIN CASH – 114
ETHER – 47
LITECOIN – 9

With regards to the currency pairs, the AUD/USD, EUR/GBP and USD/CHF are some of the hardest to trade, as is so often the case, because these all have trading ranges of less than 50 pips, which makes it very hard to consistently make money from short-term trades when you take account of the spreads per trade.

However there are several pairs that have trading within decent trading ranges. The GBP is very volatile at the moment, so many GBP pairs are worth a look, and the EUR/USD and USD/CAD pairs also have an average trading range of 78 and 76 points respectively, which is not bad at all.

Elsewhere, the Dow Jones has an average trading range of 239 points, which means you could potentially make some decent returns if you call the direction right, and the oil markets have also been quite volatile in recent days, which presents some decent short-term trading opportunities.

Finally, the major cryptocurrencies have taken a hit in recent weeks and have decent trading ranges, but until the spreads tighten up considerably, they are not really a viable day trading instrument at the moment.

Updated Trading Ranges for October 2018

I have just been looking at the very latest trading ranges right now in October 2018, and if you compare the latest figures to the figures from May (shown in brackets), there are some interesting findings:

AUD/USD – 46 (49)
EUR/CHF – 55 (67)
EUR/GBP – 43 (43)
EUR/USD – 64 (78)
GBP/USD – 90 (84)
GBP/JPY – 118 (123)
USD/CAD – 63 (76)
USD/CHF – 45 (48)
USD/JPY – 57 (63)

FTSE 100 – 93 (67)
DOW JONES – 343 (239)
NASDAQ – (138) 85
S&P 500 – 37 (25)
BRENT CRUDE – 171 (140)
CRUDE OIL – 155 (129)

BITCOIN – 162 (379)
BITCOIN CASH – 25 (114)
ETHER – 10 (47)
LITECOIN – 2 (9)

You will immediately notice that the average daily trading range is roughly the same for all the major currency pairs.

In fact in almost every case the volatility has reduced ever so slightly. The only exception is the GBP/USD which currently has an increased average trading range of 90 points, making it a good pair for day traders to trade.

It is the other figures that really stand out. You will see that after the heavy stock market falls, volatility has increased by around 50% on the major US stock markets and the FTSE 100, as shown in the chart below:

Dow Jones Average Trading Range and Volatility

Similarly, as a result of the recent fall in oil prices, the volatility of Brent and US crude oil has also increased quite considerably, although not quite as much as the major stock markets.

Finally, it is interesting to look at the latest figures for some of the major cryptocurrencies because you can see that volatility has dropped off massively since May.

Bitcoin now has an average range of just 162 points right now, making it almost impossible to day trade because of the large spreads offered by many brokers, while the other cryptos quoted are approximately 25% as volatile as they were earlier in the year.

So at this moment in time, it is the oil markets and the major stock market indices that are the most volatile, and therefore the most suitable for day traders to trade right now.

If you are interested in day trading, it is important to use a broker that has tight spreads and fast execution, and FXTM satisfies both of these criteria, with spreads starting from 0.1 points on ECN accounts and 0.5 points on Standard accounts.

Filed Under: Analysis Tagged With: atr, average true range

The Effect Of ‘Brexit’ On The GBP/USD Pair

March 17, 2016 by James Woolley Leave a Comment

When I last wrote about this pair back in October 2015, I mentioned at the time that this was at a critical point because a decisive break downwards through the trendline could potentially lead to a sustained move to the 1.46-1.48 area.

As it turned out, the price fell a lot further than that because the growing threat of a realistic withdrawal from the EU, annoyingly referred to as ‘Brexit’ by the British media, prompted it to fall to 1.3836 at one point.

At this moment in time, the bookmakers are quoting odds of 4/11 that voters will ultimately vote to remain in the EU, and odds of 2/1 that they will vote to leave the EU.

So based on the fact that bookies are usually correct on these matters, this would suggest that an exit is still highly unlikely, and the slight recovery of the British pound reflects this fact.

So where does the GBP/USD go from here?

Well the price is obviously going to be heavily influenced by Brexit over the coming months. For example, if Barack Obama and other major political figures voice their opinion and leading business figures continue to have their say, this may influence the opinion polls, which in turn could result in some big price swings leading up to the actual vote itself.

However it’s also worth taking a quick look at the GBP/USD price chart as well because from a purely technical perspective, this pair is trading in a pennant at the moment with converging trendlines, and therefore could be set for a decent breakout when the price moves out of this narrow trading pattern:

GBPUSD_March2016

A break upwards could see the price move towards the long-term 200-day exponential moving average at around 1.48, whilst a downwards breakout is likely to see the price test the recent lows and possibly drop a lot further.

Therefore it is worth paying attention to this pair in the coming days and weeks because there could be a decent trading opportunity at some point, particularly if the price breaks downwards because this will confirm the longer term trend.

Filed Under: Analysis Tagged With: brexit, gbpusd

The Forex Pairs And Markets You Should Be Trading This Month (November 2015)

November 25, 2015 by James Woolley Leave a Comment

The Christmas holiday period is usually a time when it is a lot harder to make money from trading because the volumes drop off quite substantially and the price moves are generally somewhat unpredictable.

Thankfully there is still plenty of time to make some decent returns before Christmas. So in this article I want to discuss which pairs (and which markets) are potentially very profitable right now.

Ideally you want to be trading those markets that are fairly volatile with large price moves every day, and the best way to obtain this information is to look at the average true range (as indicated by the ATR indicator) for each of these markets:

AUD/USD – 62
EUR/CHF – 47
EUR/GBP – 49
EUR/USD – 77
GBP/USD – 79
GBP/JPY – 112
USD/CAD – 75
USD/CHF – 63
USD/JPY – 57

FTSE 100 – 77
DOW JONES – 167
NASDAQ – 52
S&P 500 – 21

BRENT CRUDE – 132
CRUDE OIL – 135

As you can see, the major forex pairs are not actually that volatile at the moment compared to previous months, with the EUR/USD and the GBP/USD, for example, having average daily trading ranges of 77 and 79 points respectively.

The only pair that generally trades within a range of 100 points or more per day at the moment is the GBP/JPY pair, which is always a fairly good pair to trade.

It is the other markets that are the big daily price movers at the moment, which is unsurprising given the current global events.

The FTSE and the Dow Jones, for example, are both very volatile at the moment, with many days seeing some large price swings.

Finally, the oil markets are not as volatile as they have been, but still generally trade within a range of about 130-135 points if you are looking for a profitable market to trade on a short-term basis.

Filed Under: Analysis Tagged With: atr, average true range, volatility

Why The GBP/USD Is At A Critical Point At The Start Of October 2015

October 2, 2015 by James Woolley Leave a Comment

At this time of the year, the summer holidays are well and truly over and we start to see decent volumes in the forex markets, and large price moves in many of the major currency pairs.

So it’s interesting to take a look at the GBP/USD pair because this is at a critical point right now.

If you take a look at the chart below, you will see that this pair has just managed to fall below the horizontal trendline (indicated by the black line), which will often signal the start of a breakout, but has had a mini-rebound since then (and is in fact moving higher and higher as I write this article):

GBPUSD_OCT15

So it is still unclear whether this is a decisive break, in which case we could see this pair fall to around 1.46 – 1.48, or whether it is going to bounce off this level once again and head back into the trading range that has been established over the last 4 or 5 months.

From a trading perspective, this is definitely not a good trading opportunity at the moment because it really is a 50/50 shot, but if we could get a few more days of consolidation where the price hovers around the trendline, followed by a large down day, this would present more of an opportunity.

That’s because you will often see the price move out of a trading range and break through a trendline before retracing slightly. It’s often the second price move that confirms the breakout.

So we will have to wait and see what happens next.

Filed Under: Analysis Tagged With: breakout, gbpusd

  • « Previous Page
  • 1
  • …
  • 14
  • 15
  • 16
  • 17
  • Next Page »

Forex Rebates:

Choose from 40+ different forex brokers and crypto exchanges, and get cashback every time you trade:


Copy Profitable Traders:

If you join ZuluTrade, you can follow and subscribe to profitable traders and all of their trades will be automatically copied in your own trading account.

You can also earn money as a signal provider if you are already a profitable trader.

Click here to find out more

Recommended Broker:

Recent Blog Posts:

  • High Probability Trade on S&P 500 – 26 January 2024
  • Oanda Moves Into Prop Trading With Labs Trader Program
  • My eToro Performance in 2023 – Up 33.24%
  • The5ers Offering $20K Bootcamp Challenge For Just $1
  • Example of VWAP Bounce Trade on S&P 500 – 18 December 2023

Recent Articles:

VWAP Indicator
  • MA Sabres (LuxAlgo) Indicator
  • 10 Harsh Truths About Forex Trading
  • Best Websites for Monitoring Currency Strengths
  • Xmaster Formula Indicator for MT4 and MT5
  • Tools:

    Currency Heat Map

    Categories

    • Analysis
    • News

    Archives

    • January 2024
    • December 2023
    • November 2023
    • October 2023
    • September 2023
    • August 2023
    • July 2023
    • June 2023
    • May 2023
    • August 2020
    • June 2020
    • May 2020
    • April 2020
    • January 2020
    • December 2019
    • November 2019
    • October 2019
    • September 2019
    • August 2019
    • July 2019
    • June 2019
    • May 2019
    • April 2019
    • March 2019
    • February 2019
    • January 2019
    • December 2018
    • November 2018
    • October 2018
    • September 2018
    • August 2018
    • July 2018
    • June 2018
    • May 2018
    • March 2016
    • December 2015
    • November 2015
    • October 2015
    • August 2015
    • July 2015

    Disclaimer

    This website should be used for general information purposes only and in no way represents professional financial advice.

    Forex and CFD trading carries a high level of risk and it is possible to lose more than your initial deposit if using leveraged products.

    Copyright © 2025 · eleven40 Pro Theme on Genesis Framework · WordPress · Log in

    • About
    • Contact
    • Disclosure
    • Privacy Policy
    • Terms Of Service