The Forex Chronicles

  • Rebates
  • Brokers
  • News
  • Analysis
  • Signals
    • Best Copy / Social Trading Platforms
    • eToro Review
    • FXTM Invest Review
    • Marketclub Review
    • ZuluTrade Review
  • Indicators
  • Strategies
  • Articles

Nasdaq Analysis 29 July 2023 – No Traction for the Bears

July 29, 2023 by James Woolley Leave a Comment

Introduction

FOMC weeks are always a lot of fun for indices traders because you can pretty much guarantee that there will be a lot of volatility after the interest rate announcement and the subsequent comments from Jerome Powell, and this week was no exception.

Although an interest rate rise of 0.25% was announced on Wednesday, as expected, we still saw some big price swings in the markets on Thursday and Friday, and I think yesterday’s price action in particular will have surprised a lot of traders.

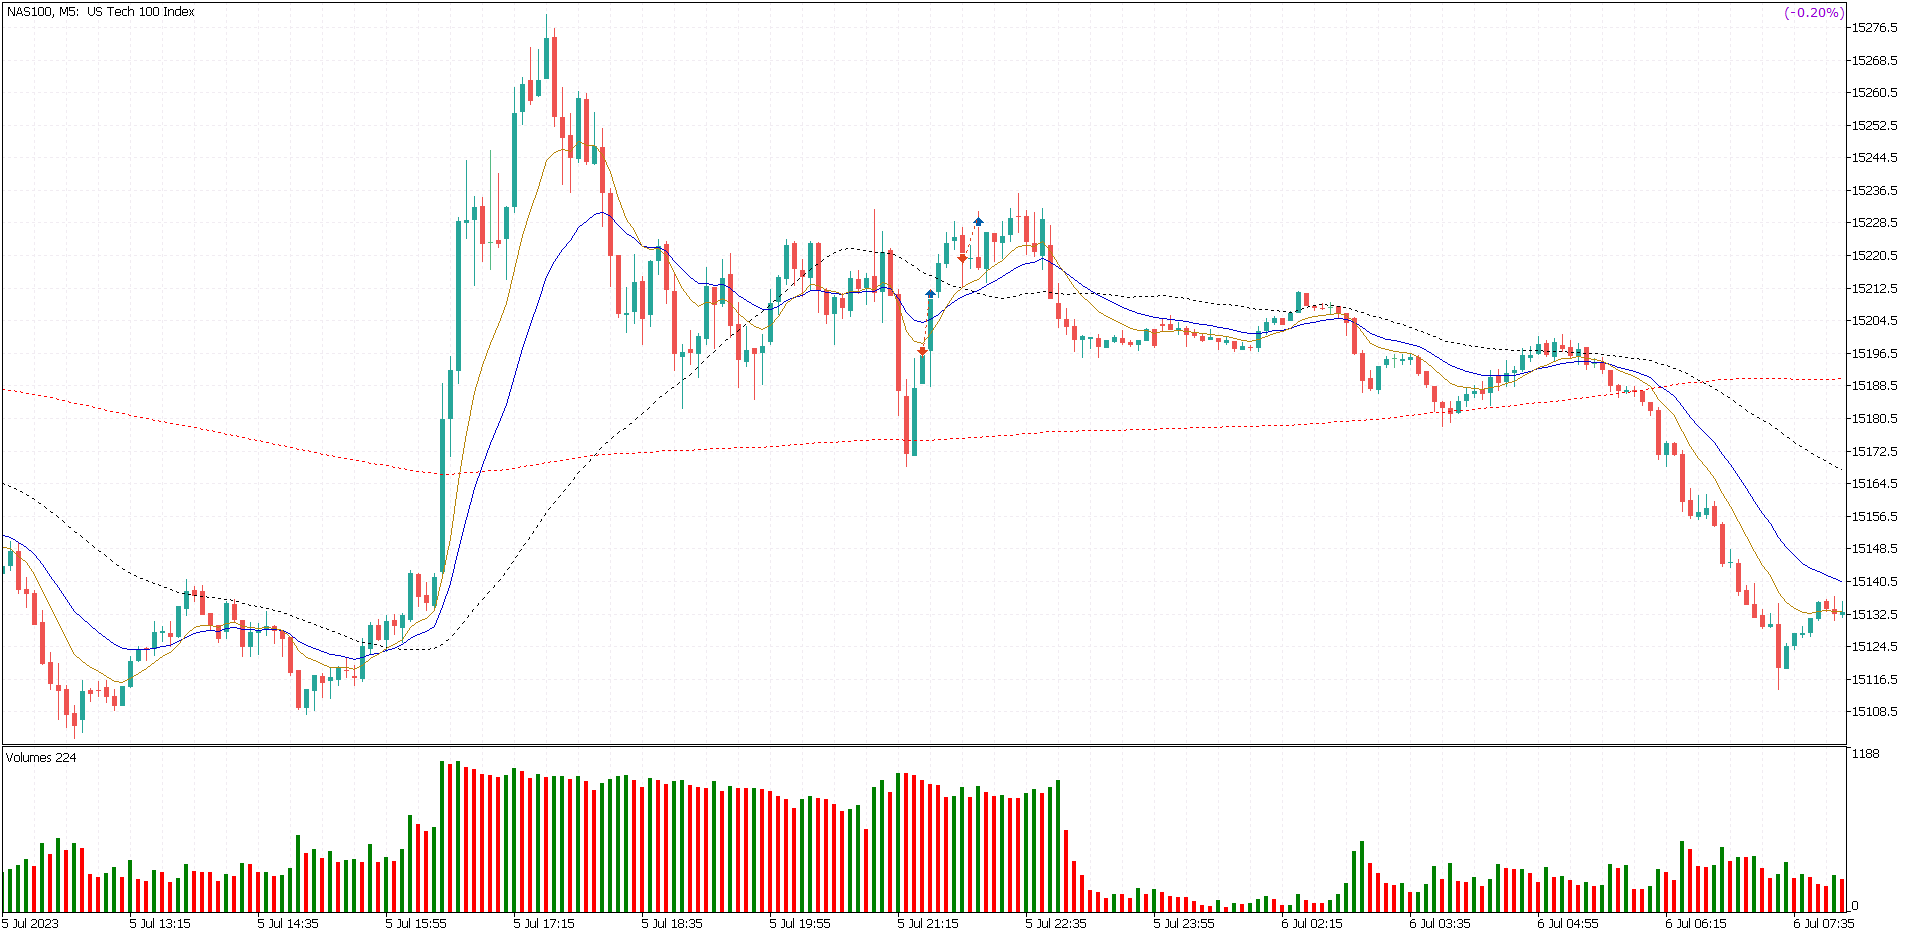
Nasdaq Chart After Thursday

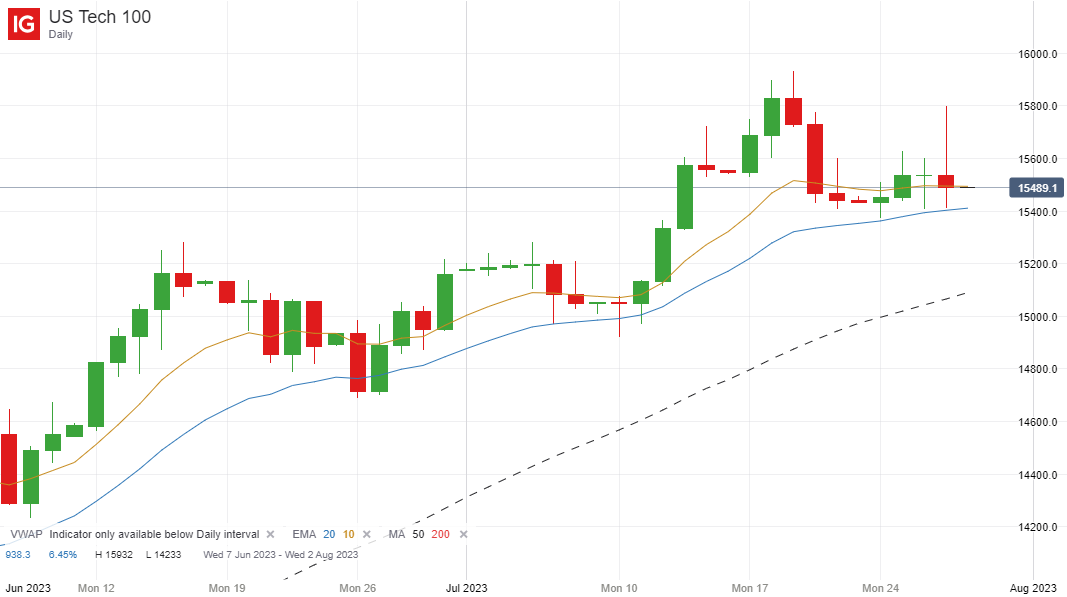
If you look at the price chart of the Nasdasq 100 after Thursday’s close, you will see that the price rallied up to around the 15,800 level early in the trading session before dropping all the back to 15,413 towards the end of the session, creating a very bearish shooting star-type candlestick on the daily chart.

It also closed just below the EMA (10) on the daily chart, which is a slightly bearish signal in itself, and was now trading fairly close to the more significant EMA (20) at around 15,400.

Therefore it was natural to assume that after seeing the price reversing sharply on the day, and with the price now trading close to the shorter term EMA’s that so often signal a change in trend when they are both breached, Friday was likely to be a continuation drive lower and the bullish trend may be coming to an end, in the short term at least.

However the Nasdaq, and the markets in general, had other ideas…

Nasdaq Chart After Friday

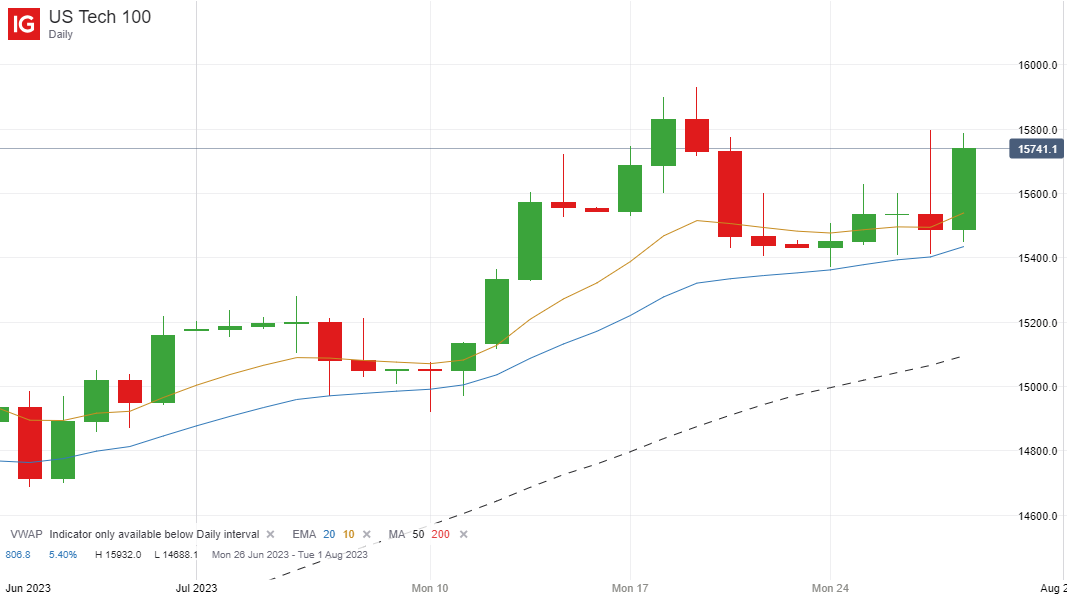
As you can see, after Thursday’s reversal, the price started to bounce back pre-market in the London session, and continued to move higher when the markets opened at 2.30 PM (UK time), closing the day and the week around 15,741.

So Friday ended up being a large inside bar, and the price reversed nearly all of the downward movement that we experienced from Thursday’s high, which just demonstrates how strong the markets are right now, and why it is foolish for bears to countertrend these markets at the moment.

When to Short the Nasdaq 100

I obviously cannot provide trading or financial advice on this blog, but if I personally was looking to short this particular index, I would be waiting for the price to close below the 20-day moving average.

Even then I wouldn’t be rushing in to enter a short straight away. I would prefer to wait for a breakout and then a retest, followed by a continuation move lower.

Final Thoughts

Overall, though, I still think the markets are still too strong to consider countertrending them, particularly after seeing Friday’s very bullish price action.

Although I think we are due a small correction at some point, we are getting towards the peak of the interest rate cycle, company earnings are coming in stronger than expected and if predictions of a minor recession (or no recession at all) are true, it is hard to see too many downward catalysts that are going to drive the markets significantly lower from here, other than a big escalation in war activities outside of the US.

Filed Under: Analysis Tagged With: nasdaq

Trading Analysis 3-7 July 2023 – Cutting Out Stupid Trades

July 9, 2023 by James Woolley Leave a Comment

A Profitable Week

I will start off by saying that I had a fairly profitable week overall in terms of day trading.

It was a shortened trading week because of the 4th July holiday and the half day on Monday, but there were still plenty of volatile price swings in the rest of the week to make up for this.

Here are the trades that I took:

  • US Oil (Monday): +32 points
  • Gold (Tuesday): +0.75 points
  • Nasdaq (Wednesday): -17.2 points
  • Nasdaq (Wednesday): -12 points
  • US Oil (Thursday): +29.5 points
  • US Oil (Friday): -17 points
  • US Oil (Friday): +17.9 points
  • US Oil (Friday): +28 points

As you can see, it was not a bad week, but the two trades that really frustrated me were the two Nasdaq trades because these could easily have been avoided.

Breaking My Rules

I’ve been trading for over 20 years now and so you would think that I would be ultra disciplined by now, but the reality is that I still place impulsive trades from time to time that are not part of my overall strategy.

These two Nasdaq trades were placed in the last two hours of trading, and I think the main reason that I took them was because I hadn’t found a decent set-up that was worth trading in the previous 11 hours from 8 AM to 7 PM UK time.

Normally I would just switch off my computer and come back the next day when this happens, but on this occasion I took two trades on the Nasdaq because I had convinced myself that it was highly likely to drop back down to the day’s lows, which it ultimately didn’t.

I think the quiet holiday period may also have been a factor because the previous day on 4 July, I only entered one trade on gold during the London session that came back and stopped me out close to break-even. So I was keen to get back into the markets and start making some money again, which is always potentially dangerous.

Trade Analysis

You can see my executions in the chart below (the red arrows show where I took my short positions and the blue arrows indicate where I was stopped out):

I don’t necessarily think there was anything wrong with the trades themselves. There were logical reasons why I entered where I did and my thesis could easily have played out on another day.

The problem was that although my potential profit would have been much more than my stop loss, in hindsight these were 50/50 trades and I generally like to enter trades where the odds of success are much more in my favour.

In addition, I shouldn’t really have been entering these trades at all because they were not based on my normal trading strategy and based on previous trades during the last few hours of trading, I know I don’t generally trade well during these hours. My win ratio is definitely no more than around 40-50% during this time.

Key Takeaways

The reason why I wanted to write this blog post was to encourage anyone else reading this to stick to their rules and not deviate from their trading strategy with stupid impulsive trades like this.

It will also help me to become more disciplined next time by writing down my thoughts and documenting them on this site.

Although I only traded these with smaller position sizes and I did at least use tight stop losses, it would have been a more profitable week if I hadn’t even considered taking them in the first place, and so this is a key lesson that I need to learn going forward.

Stick to your rules and your proven trading strategy, and don’t place impulsive trades when you haven’t found any set-ups in your usual trading windows and are looking to get back into the markets.

Filed Under: Analysis Tagged With: day trading, nasdaq

Opening Range Breakout on US Crude Oil – 14 June 2023

June 14, 2023 by James Woolley Leave a Comment

Introduction

Opening range breakouts can be some of the easiest and most profitable trades to execute when you get some good set-ups, and today we had a textbook set-up on the US crude oil market.

I like to wake up and start scanning my charts around 7 AM UK time, and as we got closer to 8 AM, it was apparent that US crude had been trading in a very tight sideways range since around 6.15 and was poised to break out of this range, either upwards or downwards, once the London market opened.

With the price hovering just above the 10 and 20-period EMAs on the 5-minute chart, and bearing in mind that we were sitting right on yesterday’s high, I wanted to see a downwards break, and that’s exactly what happened:

Trade Execution

With this type of set-up, it is best to either enter a trade on the 1-minute chart or enter a position based on pure price action.

That’s because if you wait for the 5-minute breakout candle to close, you will often find that a large part of the move will have taken place already, and subsequently you will be entering too late.

I myself did the latter and entered a short position straight after the London market opened when I saw the price starting to tick down fast, getting in at 6973.7, ie $69.737.

I placed my stop loss at the high of the previous 5-minute candle at 6982.3, 8.6 points away, and I was initially planning to exit half the position at VWAP, approximately 18 points away and indicated by the thick black line on the chart, and then let the other half run in case the price blasted straight through it.

As you can see, the VWAP ended up acting as support as it so often does, and after closing half the position at VWAP, the price came right back up and nearly took me out at break-even.

However thankfully the price came back down and I eventually decided to close the other half out at VWAP once again when I had the chance because it wasn’t acting right.

So the total profit from this trade was around 18 points, representing a reward to risk of over 2 to 1, which I am always more than happy with.

After all, if you can find risk-reward trades of 1-2 (trades that return 2 points of profit for 1 point of risk), if they only work out 40% of the time, for example, you will still earn some decent profits in the long run.

Closing Comments

The main point I wanted to get across is that the opening few hours of the London trading session can be very profitable if you like to trade opening range breakouts.

The key is to find markets that have traded in a very narrow range leading up to the open because in the case of US crude, for example, we know from my last post that it trades in a range of around 236 points on average at the moment.

Therefore when it traded in a 30-point box from 6.15 to 8.00 AM UK time, something had to give. It was inevitable that we would see a breakout. All I had to do was be patient and jump on board when it eventually happened.

Of course there will be false breakouts from time to time, but when this occurs, the secondary breakout will often be the one that cancels out the initial loss and brings in the big money.

So always try to look out for sideways consolidations in otherwise volatile markets because the price is very unlikely to stay in this tight range for very long.

Filed Under: Analysis Tagged With: breakout, oil, opening range breakout, us crude

Average Daily Trading Range of the Major Forex Pairs in 2023

June 11, 2023 by James Woolley Leave a Comment

Introduction

If you are day trading the forex markets, or like to trade commodities, cryptocurrencies or stock market indexes, for example, it is always useful to know which markets are showing high levels of volatility and trading in a wide range on a daily basis.

That’s because a market that is moving in a range of 200 pips per day will be a lot easier to capture decent sized profits from than a market that is only moving around 20 pips per day on average, for instance, particularly when you factor in spreads and commissions.

So with that in mind, let’s take a look at the latest average true range (ATR) readings of all of the major currency pairs, indices, commodities, metals and cryptos as of right now (11 June 2023) as we head into the quieter summer period.

This will tell you which markets are potentially worth day trading, and which ones are probably best avoided.

Major Currency Pairs

  • AUD/NZD – 57
  • AUD/USD – 58
  • EUR/CHF – 40
  • EUR/GBP – 37
  • EUR/JPY – 94
  • EUR/USD – 51
  • GBP/EUR – 49
  • GBP/JPY – 118
  • GBP/USD – 81
  • USD/CAD – 65
  • USD/CHF – 61
  • USD/JPY – 90

There is no doubt that the average true range of these forex pairs has fallen since I last compiled this data back in 2020, but that’s to be expected because that was a very volatile period as COVID was just starting to take hold all over the world.

The reality is that there are plenty of currency pairs that still offer a good deal of price movement every day, and are therefore potential trade candidates.

I myself like to mainly trade the GBP/JPY and GBP/USD pairs because they have a wide daily trading range, 118 and 81 pips respectively, as shown here, and I’m also predominantly based in the UK, which means I can trade the busy London and New York sessions.

I also used to like to trade the EUR/USD pair but this seems to move less than before, just 51 pips, and I find that the GBP pairs give me more than enough opportunities every week.

For those traders based in Asia, the major Yen pairs all provide lots of liquidity and volatility, and benefit from tight spreads, while traders based in Australia or New Zealand may also prefer to trade these pairs because of the favorable time zone and the fact that these are more volatile than the Australian and New Zealand dollar pairs.

USA-based traders are lucky because many of the USD pairs offer big price swings every day, especially the GBP/USD and USD/JPY pairs, but many of the currency pairs are very active during the US session, so most of the major pairs can potentially be traded profitably at this time.

Stock Market Indices

  • FTSE 100 – 58
  • DAX – 123
  • DOW JONES – 269
  • S&P 500 – 40
  • NASDAQ 100 – 195

With the S&P 500 hanging out in the 4050-4150 range for several weeks and seeming reluctant to fall back down, the volatility of this index fell sharply, and now has a daily average price movement of just 40 points.

This has made it noticeably harder for many day traders to trade because there have been a lot of sideways price movements in recent months, which will often chop you up.

The other indices have also experienced narrower trading ranges, with the Nasdaq 100 almost half as volatile (195 points) as it was this time last year, for example.

That’s to be expected when we experience rising stock markets, but it’s not necessarily beneficial to day traders, who can often generate more profits when the markets are falling, or at least fluctuating up and down a lot more.

Commodities

  • BRENT CRUDE – 225
  • US CRUDE – 236
  • GOLD- 23
  • SILVER – 48

Gold, and to a lesser extent silver, often present day traders with plenty of volatity, and that’s still the case now. With a daily range of $23, gold still continues to trade in quite a wide range on a daily basis.

As you can see below, the oil markets have calmed down a lot since a year ago, when they were moving an average of 500 points per day, but I find that they still offer lots of good trading opportunities with a trading range in excess of 200 points per day.

Brent Crude Average True Range 2023 Chart

Cryptocurrencies

  • BITCOIN – 861
  • ETHEREUM – 58

There was a time when day trading cryptos was practically impossible because of the prohibative spreads, but with a daily trading range of 861 points on Bitcoin, for example, and much tighter spreads, it is now possible to generate profits from these daily price movements.

I don’t attempt to do so myself, but I know a few people who find that their usual day trading strategies work just as well, if not better on these instruments.

Final Thoughts

It is often said that scalpers should look to capture around 10% of the daily average true range (ATR) per trade, while proficient swing traders should look to capture up to 40% of the average range.

So despite the fact that we are entering one of the quietest periods of the year when many people will be taking vacations and enjoying the summer, there is still plenty of volatility in the markets to keep day traders satisfied.

I like to focus my attention on the GBP/JPY and GBP/USD pairs, as well as gold and US crude oil, but with average trading ranges of 195 and 269 points on the Nasdaq and DJ30 respectively, it’s easy to see why some traders focus on the indices instead.

Ultimately it comes down to your own personal trading strategy and what works for you, but finding the markets with the highest volatility will often help you in your quest to generate consistent returns.

Filed Under: Analysis Tagged With: atr, average true range, daily trading range, volatility

Account-Destroying Trading Range in the S&P500 – 23 May 2023

May 23, 2023 by James Woolley Leave a Comment

Introduction

As a day trader, you always want to see strong trends upwards or downwards with plenty of volatility because this will enable you to either ride these trends upwards or downwards, or trade the reversals when these trends run out of momentum.

The one thing you don’t want to see is a very narrow trading range with little or no volatility because this can make it very difficult to find winning trades, and can actually destroy accounts.

However this is exactly what we saw in the first 3 hours of the trading session when the S&P500 market opened earlier today, as you can see below:

Trading Range

The price did fall later in the day, but during this opening 3-hour session, when most day traders like to trade, the price of the S&P500 was just drifting in a sideways trading range between about 4178 and 4185, which is just a 7 point range.

There were a few occasions when the price moved out of this range, but it quickly moved back to this trading range each time.

Why Narrow Ranges Are So Hard to Trade

There are some day traders who like to trade tight trading ranges like this, and will just continue to sell short at the top of the range and go long at the bottom of the range, capturing small profits each time, but the vast majority of day traders don’t trade like this.

Most day traders will tend to trade breakouts out of this range in the hope of capturing the start of a new trend, and when you get a sideways market like this, it can potentially destroy accounts as traders keep getting stopped out on every possible breakout.

The problem is that you don’t really know that the market is going to trade like this before the market opens. In fact the S&P500 (future) actually moved more than this when the US market was closed, trading as high as 4210 in the overnight Asian session.

So you would think that having fallen so much out of hours, the price would move a lot more when it actually happened, but this wasn’t the case today.

Closing Comments

The point I want to get across is that very tight trading ranges are generally very bad news for the vast majority of day traders because they can really chop you up and result in lots of small losses.

There is no way of knowing whether you are likely to experience a day like today ahead of time, although the market will sometimes give you clues.

For example, if you get two or three days where the trading range has been well above the ATR (average true range) on the daily time frame, then there is a higher chance that you will see a smaller consolidation day with a tight range at some point.

Similarly, if you have a large daily candle up and an equally large daily candle down with the price closing somewhere near the middle, you are quite likely to see an inside bar day in the third day.

Finally, if the price has been trading in a narrow range on the higher time frames, which the S&P has been doing, then this increases the chances of a tight range as well.

Therefore if you are struggling to make money from day trading the S&P right now, you certainly aren’t alone.

The S&P500 can be a great market to trade, but it might be a good idea to trade more volatile markets such as oil or the major forex pairs when this index continues to trade in a narrow range on the daily chart.

Filed Under: Analysis Tagged With: s&p500, spx

  • « Previous Page
  • 1
  • 2
  • 3
  • 4
  • 5
  • …
  • 17
  • Next Page »

Forex Rebates:

Choose from 40+ different forex brokers and crypto exchanges, and get cashback every time you trade:


Copy Profitable Traders:

If you join ZuluTrade, you can follow and subscribe to profitable traders and all of their trades will be automatically copied in your own trading account.

You can also earn money as a signal provider if you are already a profitable trader.

Click here to find out more

Recommended Broker:

Recent Blog Posts:

  • High Probability Trade on S&P 500 – 26 January 2024
  • Oanda Moves Into Prop Trading With Labs Trader Program
  • My eToro Performance in 2023 – Up 33.24%
  • The5ers Offering $20K Bootcamp Challenge For Just $1
  • Example of VWAP Bounce Trade on S&P 500 – 18 December 2023

Recent Articles:

VWAP Indicator
  • MA Sabres (LuxAlgo) Indicator
  • 10 Harsh Truths About Forex Trading
  • Best Websites for Monitoring Currency Strengths
  • Xmaster Formula Indicator for MT4 and MT5
  • Tools:

    Currency Heat Map

    Categories

    • Analysis
    • News

    Archives

    • January 2024
    • December 2023
    • November 2023
    • October 2023
    • September 2023
    • August 2023
    • July 2023
    • June 2023
    • May 2023
    • August 2020
    • June 2020
    • May 2020
    • April 2020
    • January 2020
    • December 2019
    • November 2019
    • October 2019
    • September 2019
    • August 2019
    • July 2019
    • June 2019
    • May 2019
    • April 2019
    • March 2019
    • February 2019
    • January 2019
    • December 2018
    • November 2018
    • October 2018
    • September 2018
    • August 2018
    • July 2018
    • June 2018
    • May 2018
    • March 2016
    • December 2015
    • November 2015
    • October 2015
    • August 2015
    • July 2015

    Disclaimer

    This website should be used for general information purposes only and in no way represents professional financial advice.

    Forex and CFD trading carries a high level of risk and it is possible to lose more than your initial deposit if using leveraged products.

    Copyright © 2025 · eleven40 Pro Theme on Genesis Framework · WordPress · Log in

    • About
    • Contact
    • Disclosure
    • Privacy Policy
    • Terms Of Service