The Forex Chronicles

  • Rebates
  • Brokers
  • News
  • Analysis
  • Signals
    • Best Copy / Social Trading Platforms
    • eToro Review
    • FXTM Invest Review
    • Marketclub Review
    • ZuluTrade Review
  • Indicators
  • Strategies
  • Articles

Crude Oil Breakout From 4 May 2020

May 10, 2020 by James Woolley Leave a Comment

Price Action

If you have been watching the price of oil in recent weeks and months, you will know that it has been on a crazy ride just recently.

Indeed there was a brief time when the oil price actually went negative when the latest contract expired, which was an unprecedented event that has never happened before.

The price had already tumbled as a result of tensions between Saudi Arabia and Russia, followed by the sharp drop-off in demand caused by global lockdowns, but the constant shorting of oil pushed the spot price of WTI Crude Oil down to just $7 per barrel.

Breakout

As countries have started to reopen for business, the price of WTI Crude has started to slowly rise again, and in this article I want to highlight a breakout that occurred last week that you may have missed.

WTI Crude Breakout - 4 May 2020

Inside bar breakouts are some of the most profitable breakouts you can trade if you wait for the right set-ups, and this was a decent example of a high probability set-up.

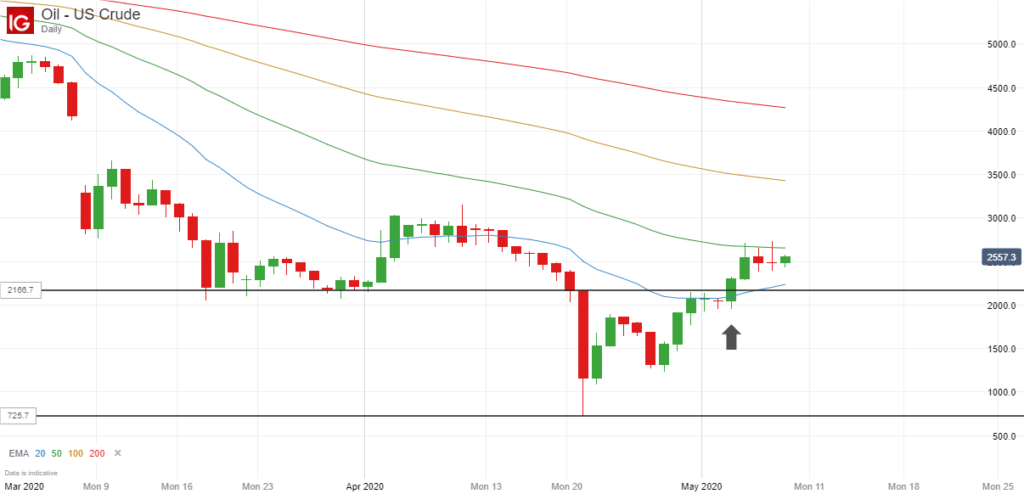
As you can see, there was initially a large red candle on 21 April 2020, but for the next ten trading sessions, the price of WTI Crude actually stayed within the entire range of this candle. So in other words, there were ten consecutive inside bars.

When this happens, there is often a strong breakout when the price finally breaks out of the range of this inside bar (and closes outside it), and that’s exactly what happened here.

On 4 May 2020, the price broke upwards out of this range and closed at almost exactly $23.

This would have been a good point to enter a long position because the price then went up to $27.15 the following day, representing a potential gain of $4.15.

Since then the price has dropped back to around the $25 mark, but I think many traders are expecting the momentum of this breakout to continue, with the price heading up towards the $30 level at some point.

Final Thoughts

I didn’t actually take this trade myself because I don’t like to trade oil on eToro (my risk score is high enough already thanks to my BP and RDSB stock holdings), but I just wanted to highlight how profitable these inside bar breakouts can be.

Just having two consecutive inside bars can be enough to give you a strong breakout trading opportunity, but it is often the case that your odds of success increase even more when you have several of these inside bars within the range of the initial candle.

That’s why I wanted to demonstrate with this example because here we had ten inside bar candles in a row, thanks to the extraordinarily large set-up candle that spooked the markets and prompted so many headlines.

It’s interesting to note that if you go back to the price chart and look at the price action before this large drop-off, you will see that there was a downward inside bar breakout just prior to this as well.

This would have got you into a short position at around $26.60, just before the big fall of nearly $20, but we can all be wise after the event, and in reality, many traders would probably have banked their profits before the price collapsed from $22 to $7.

The point is that you want to keep an eye out for these inside bar set-ups. They work really well on the longer time frames in particular, and when they occur at a peak or a trough, the resulting breakouts can potentially be large enough to give you some good gains.

Filed Under: Analysis Tagged With: breakout, inside bar, oil

3000 Could Be Key Resistance Level For S&P 500

April 16, 2020 by James Woolley Leave a Comment

2020 Price Action So Far

It is fair to say that 2020 has been a complete disaster for many stock market investors thanks to the global coronavirus pandemic that has effectively closed down the world’s economy.

You only have to look at the price chart of any mid-large cap stock, or any major stock market index for evidence of this.

The S&P 500 is a classic example. Even as recently as February, this index was closing in on 3400 and making new all time highs before the virus started spreading outside China.

However things really turned negative in March as the effects started to be felt in many countries all over the world, with thousands of new infections and rapidly growing death rates ultimately leading to complete lockdowns and the closure of many businesses.

Subsequently, the S&P 500 fell all the way down to around 2200 at one point, so it is quite remarkable that it has since recovered back up to the 2800 level.

Strong Resistance

At the moment, however, it is hard to see this upward price move continuing for much longer.

As I posted on my eToro feed yesterday, it is getting closer to its 200-day exponential moving average, which by itself often acts as strong resistance.

However the fact that this indicator is also very close to the 3000 level, ie a major round number, makes this even more significant because it is likely to provide even stronger resistance.

Here is the chart that I posted yesterday:

SPX500 - 15Apr

Since then, the S&P 500 has fallen from 2830 to it’s current overnight level of 2800, and all of the additional indicators are still suggesting that this market is currently in overbought territory and likely to fall, as you can see below:

SPX500 -April 16

The MACD histogram is slowly falling as the price has been rising and the stochastic indicator is still above 80, suggesting it has potentially reached a peak. The only exception is the RSI indicator because this has not yet crossed above 70, suggesting that the price could yet go slightly higher.

However this latest price chart is still pointing towards further weakness in the coming days and weeks.

The Fundamental Argument

It is all well and good looking at the price charts to make trading decisions, but it is often good to look at the fundamentals as well.

The S&P 500 has been trading on a large P/E ratio for several years now, prompting many to sell their index ETFs, VOO, SPY, etc, and wait for a reversal to buy back in cheaper.

Even though the index is well below it’s all-time high, the fact remains that it is still trading on a very high multiple. As of yesterday, iShares’ IVV was still trading on a P/E ratio of 18.75, and this doesn’t really account for the fact that the earnings part of this formula is likely to fall sharply later this year, pushing the P/E up even further.

Final Thoughts

So these are some of the reasons why I think the S&P 500 is likely to fall in the near future. There are strong arguments both fundamentally and technically why the S&P 500 could easily drop to 2500 again, and possibly even further.

When you also take into consideration the fact that we are still a long way off developing a vaccine for COVID-19, and many countries are still in lockdown, it really is hard to put forward any arguments why this index should rise much further at the present time.

Filed Under: Analysis Tagged With: s&p500, spx

My Trading and Investing Goals for 2020

January 2, 2020 by James Woolley Leave a Comment

Introduction

It’s always a good idea to look back on the previous year’s trading results at the end of a year, reflect on these results and set yourself goals for the coming year in order to keep improving as a trader / investor.

So having just completed a full year as a trader on the eToro social trading platform (user account = SteadyProfits), I thought it would be a good idea to talk about my personal trading goals for 2020.

This is primarily for my own benefit so that I can look back at this blog post at the end of the year, and see if I actually achieved these goals, but it may also help you to get into the mind of how an experienced trader thinks (as someone who has been trading the markets for over 20 years now).

Profit Target

The first thing I will say is that I never set myself a specific profit target. I will take whatever I can get from the market.

In 2019 the global stock markets rallied strongly, and even the UK markets surged higher at the end of the year after Boris Johnson’s Conservative party won the General Election.

I would like to think that my trading skills were solely responsible for making a 20.98% gain last year and turning a notional $10,000 into $11,794 since I first joined eToro in November 2018, as shown below, but I have to be realistic and accept that the strong markets contributed to this impressive profit result in a small way.

SteadyProfits Notional Portfolio Value

So what I am basically saying is that I can’t expect to make a similar gain of over 20% if the markets were to fall 20% in 2020.

However my goal is to still make an overall profit regardless of market conditions thanks to having a more diversified portfolio, which could include bonds and commodities, for example, and not just stocks.

High Yield Portfolio

A trademark of both my eToro trading account and my main ISA is that they are both full of good quality large-cap stocks that pay generous dividends.

This is one of the main benefits of investing in the UK stock market. There are many large companies that are well-past their growth stage and now just keep growing their profits slowly and distributing cash to shareholders every year.

Examples of such stocks include Aviva, BP, HSBC, Royal Dutch Shell and Imperial Brands, all of which I currently hold in both my eToro account and my ISA accounts, and I will continue to invest in such stocks in 2020, particularly when their share price trades at a discount and represents good value.

Regular Income

Following on from the last point, I will also continue to invest in stocks that pay dividends regularly in order to give myself a constant revenue stream, which I can then reinvest back into the market to benefit from compounding.

I am a big fan of any assets that pay dividends quarterly, or even monthly if possible, which is why I will continue to buy large-cap stocks that pay generous quarterly dividends, as well as good quality REITs that distribute profits on a quarterly or monthly basis.

Returning to Forex Trading

I used to be quite an active forex trader before I became more of an active stock trader and investor, and I plan on doing a little more currency trading in 2020. That was the whole reason why I started this blog to begin with.

Therefore I will be going back to some of my tried and tested strategies where time permits, and may also start to develop some new forex trading strategies.

Attracting More Copiers

One final goal that I hope to achieve in 2020 is to attract more copiers on eToro. I aim to do this primarily by continuing to produce good results, but also through the use of this website and an increased presence on social media.

As of right now at the start of 2020, I currently have five people actively copying all of my trades, but I would like to have at least 20-50 copiers in the coming year and at least $100,000 AUM (assets under management), which is a fairly conservative target that I should hopefully be able to achieve.

This will enable me to move up through the levels of eToro’s Popular Investor program and subsequently generate more revenue, which in turn can be put to use in the market.

Filed Under: Analysis Tagged With: investing goals, trading goals

USD/JPY Analysis November 2019 – Downward Breakout Possible

November 25, 2019 by James Woolley Leave a Comment

Price Action

It has been interesting to watch the price action of the USD/JPY pair in recent months because after hitting a low of around 104.46 back in August, it has been slowly trending upwards since then, and currently trades at 108.80 at the time of writing.

Indeed as you can see from the price chart below, the price has bounced back so much, it has not only touched the 200-day exponential moving average (as indicated by the red line), but has also traded above it for quite a while.

USDJPY Daily Chart - November 2019

Downward Price Breakout

You can also see from the chart above that it was clearly trending within two trendlines that marked the high and low points of this rising trend, but significantly closed below the lower trendline last week.

To be honest, I was expecting that this would probably mark the end of the recent uptrend, and would be the catalyst for a new downward move for the USD/JPY, but so far there hasn’t been a wave of selling to drive the price lower.

This is probably because some analysts, including Goldman Sachs, have been talking down the prospects of a recession in the US and global economy in 2020, predicting growth rates of 2.3% and 3.4% respectively for the coming year.

Nevertheless, there is still a possibility of a strong bearish candle forming on the daily chart in the next few days, so it could still be worth watching.

Future Price Moves

If the price does trade strongly lower, and closes below its two recent lows of 108.24 and 108.28, then I would be fairly confident that this would signal the start of a new downward price breakout.

As a result of this, the price would close below all of its major moving averages (20, 50, 100 and 200-day EMAs) and there is a lot of downside potential because it could easily drop back into the 104 – 106 range.

The alternative scenario is that the recent short-term strength in the USD/JPY continues, and we continue to see the price trading upwards of 109.

If this were to happen, then we would see the 50 and 100-day EMAs cross over the EMA (200), which is a very bullish signal that could attract a wave of buying to push the price above its previous highs of 109.50 and beyond the 110 level.

So the point is that while the picture is still unclear, the price action of the USD/JPY over the coming days and weeks could give you a strong indication as to whether there is going to be a sustained upwards or downwards trend in the near future.

I would probably favour a downward breakout at this moment in time simply because the MACD and stochastic indicators are suggesting that this long-term upward trend is running out of momentum on the weekly chart, but as I say, there is no need to second-guess the direction of any breakout until we get some clearer signals on the daily chart.

Filed Under: Analysis Tagged With: breakout, usdjpy

EUR/USD Price Action in 2019 Highlights Importance of EMA (200)

November 18, 2019 by James Woolley Leave a Comment

Moving Average Trend Benefits

If you ask a technical trader which indicators they like to use when trading the forex markets, you can be certain that many of them will use moving averages.

That’s because these simple indicators give you an instant snapshot of the current trend in the markets.

It doesn’t matter if you are using the simple, exponential, volume or weighted moving average. If the indicator is moving higher, then the market is in an upward trend, and if it is moving lower, it is obviously in a downward trend.

The 200-Day Moving Average

You can use many different period settings for whichever moving average you like to use to immediately identify the short, medium and long-term trend at any given time, but one of the most useful and most widely used indicators that many longer term traders like to use is the 200-day moving average.

It is largely down to personal preference whether you use the simple or exponential moving average, but they both highlight the long-term trend really well.

I personally use the 200-day exponential moving average, or EMA (200) for short, and have always found it to be really useful when trading currencies and stocks.

It’s often significant when the price breaks through this EMA (200), and is equally significant when many of the shorter-term moving averages cross above or below this indicator because it will often indicate a change of trend.

However it can often act as a strong support or resistance level, particularly after the price has risen or fallen sharply in a short space of time, and in this article I thought I would demonstrate this by showing you the daily price chart of the EUR/USD pair:

EURUSD Daily Price Chart 2019

Strong Resistance in 2019

As you can see from the chart above, the price of the EUR/USD has been slowly trending downwards for much of 2019, but there have always been some mini-rallies along the way.

More importantly, you will see that on most occasions the price has not only struggled to break through this key indicator (shown in red), but has run into strong resistance and been actively driven lower every time it came close to this indicator, except for one occasion when it briefly traded slightly above particular indicator.

Conclusion

Therefore the point that I want to get across in this article is that traders pay close attention to the 200-day exponential moving average, and as a result of this, any resulting price moves almost become self-fulfilling once the price starts to move away from this key level.

On many occasions it will act as strong support or resistance, as was the case here with the EUR/USD, where you could have made some good returns going short each time the price got close to the EMA (200), but it can also signal a change of trend when it is finally broken, in which case you can also potentially make some good returns because you can get in at the start of a new trend.

So it is always worth adding the EMA (200) to your daily price chart if you like to trade this time frame.

Filed Under: Analysis Tagged With: eurusd

  • « Previous Page
  • 1
  • …
  • 3
  • 4
  • 5
  • 6
  • 7
  • …
  • 17
  • Next Page »

Forex Rebates:

Choose from 40+ different forex brokers and crypto exchanges, and get cashback every time you trade:


Copy Profitable Traders:

If you join ZuluTrade, you can follow and subscribe to profitable traders and all of their trades will be automatically copied in your own trading account.

You can also earn money as a signal provider if you are already a profitable trader.

Click here to find out more

Recommended Broker:

Recent Blog Posts:

  • High Probability Trade on S&P 500 – 26 January 2024
  • Oanda Moves Into Prop Trading With Labs Trader Program
  • My eToro Performance in 2023 – Up 33.24%
  • The5ers Offering $20K Bootcamp Challenge For Just $1
  • Example of VWAP Bounce Trade on S&P 500 – 18 December 2023

Recent Articles:

VWAP Indicator
  • MA Sabres (LuxAlgo) Indicator
  • 10 Harsh Truths About Forex Trading
  • Best Websites for Monitoring Currency Strengths
  • Xmaster Formula Indicator for MT4 and MT5
  • Tools:

    Currency Heat Map

    Categories

    • Analysis
    • News

    Archives

    • January 2024
    • December 2023
    • November 2023
    • October 2023
    • September 2023
    • August 2023
    • July 2023
    • June 2023
    • May 2023
    • August 2020
    • June 2020
    • May 2020
    • April 2020
    • January 2020
    • December 2019
    • November 2019
    • October 2019
    • September 2019
    • August 2019
    • July 2019
    • June 2019
    • May 2019
    • April 2019
    • March 2019
    • February 2019
    • January 2019
    • December 2018
    • November 2018
    • October 2018
    • September 2018
    • August 2018
    • July 2018
    • June 2018
    • May 2018
    • March 2016
    • December 2015
    • November 2015
    • October 2015
    • August 2015
    • July 2015

    Disclaimer

    This website should be used for general information purposes only and in no way represents professional financial advice.

    Forex and CFD trading carries a high level of risk and it is possible to lose more than your initial deposit if using leveraged products.

    Copyright © 2025 · eleven40 Pro Theme on Genesis Framework · WordPress · Log in

    • About
    • Contact
    • Disclosure
    • Privacy Policy
    • Terms Of Service