The Forex Chronicles

  • Rebates
  • Brokers
  • News
  • Analysis
  • Signals
    • Best Copy / Social Trading Platforms
    • eToro Review
    • FXTM Invest Review
    • Marketclub Review
    • ZuluTrade Review
  • Indicators
  • Strategies
  • Articles

AUD/NZD Still in a Very Strong Downward Trend in January 2019

January 28, 2019 by James Woolley Leave a Comment

Introduction

A lot of traders tend to focus on the British pound, the US dollar and the Japanese yen when trading the currency markets, but there are a few other pairs that have relatively low spreads, and are potentially very profitable to trade.

One such pair that often goes unnoticed by traders is the AUD/NZD pair, but it has been interesting to watch the price action of this particular pair in recent times because the New Zealand dollar continues to strengthen against the Australian dollar over time, and is not really showing any signs of reversing this trend.

Strong Downward Trend

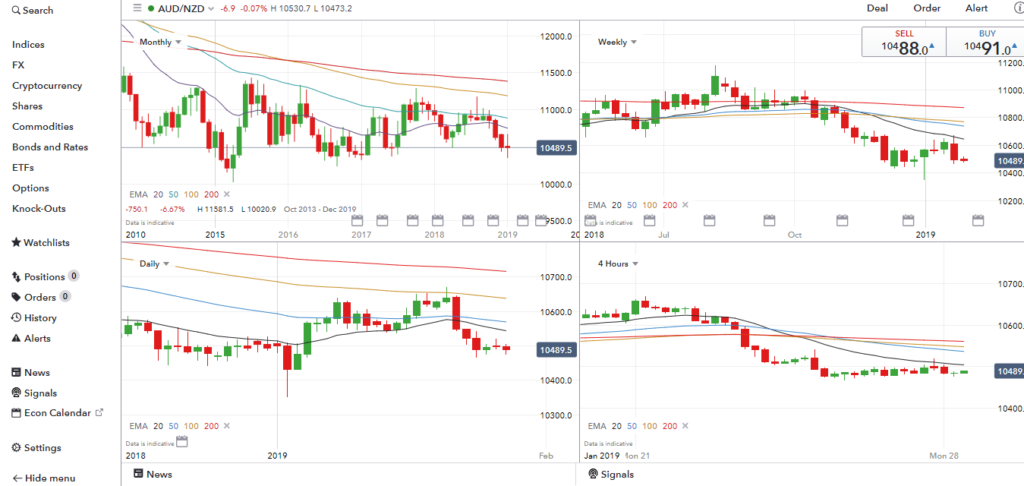
One way of determining the current price trend is to add the 20, 50, 100 and 200-period exponential moving averages to your daily price chart, and see where the price trades in relation to these moving averages.

If the price is above all four of these moving averages, then it is in a strong upward trend, and if it is trading below all four of these moving averages, it is obviously in a strong downward trend.

Furthermore, if the price is also trading above or below these moving averages on multiple time frames, such as the weekly and monthly charts, for example, then you know that it is in an established long-term trend right now.

That’s precisely the case with the AUD/NZD pair because as you can see from the chart below, the price is trading below the 20, 50, 100 and 200-period exponential moving average on the monthly, weekly, daily and 4-hour charts:

AUDNZD Strong Downward Trend - January 2019

Trading Opportunity

The question is; how you can actually capitalize on this long-term trend?

Well with such a strong trend in place, you might think that you can make money just by selling into any strength, and in many cases this may well be profitable.

However I would probably look for opportunities to go short on the daily time frame, and particularly around the 100 and 200-day moving averages because this is where the price is likely to run into some strong resistance.

Therefore any time there is a pin bar around these levels or divergence on one or more indicators, for instance, this would probably be a good time to take a short position.

Filed Under: Analysis Tagged With: audnzd

EUR/GBP May Find Support At 2018 Low

January 25, 2019 by James Woolley Leave a Comment

Recent Price Action

The British pound has rallied strongly in recent weeks as the threat of a no-deal Brexit recedes and the likelihood of a delayed Brexit increases as the days go by.

Subsequently the GBP/USD and the GBP/JPY have both moved strongly higher, and the EUR/GBP has fallen sharply as it has strengthened against the Euro.

It is this particular pair that I want to focus on in this article because this popular, slow-moving forex pair is now trading close to a key support level that may just prevent the price from falling any further.

2018 Low

The support level that I am talking about is simply the low of 2018. As you can see in the weekly chart below, the lowest price from last year was 0.8620, and interestingly enough, the current price at the time of writing is just a fraction above this at 0.8634, although it did actually hit this price yesterday before reversing.

EURGBP Weekly Chart - January 2019

Therefore as we haven’t really seen any strong support in this recent price fall, this may be the point at which traders start to bank their profits and open new long positions if there is the slightest indication of strength or a clear sign of a reversal.

Potential Trading Opportunity

Whenever the price of any instrument approaches a key support or resistance level, it is always interesting to watch the price action and see how it reacts around this level.

So in this case we really need to see clear signs of strength in order to be confident of a reversal, even if it turns out to be a relatively modest one.

The price of any pair that includes the British pound is still heavily influenced by Brexit, which means that this is not really a time to take long-term trades.

This is a time to take quick short-term technical trades and get out as soon as you are showing a decent profit, and so it may be worth opening a long trade on a pin bar, for example, on one of the lower time frames.

Alternatively if the price ambles along around this key support level and doesn’t really show any real signs of strength before eventually breaking below this level, this could be a time to jump on board with a short position.

That’s because the price is now trading close to the 200-week exponential moving average, and there is a lot of downside potential if the price breaks below this level.

Either way, it is worth keeping an eye on this particular pair to see what happens in the coming days.

Filed Under: Analysis Tagged With: brexit, eurgbp

Dow Jones and Gold Trading Close to Major Resistance Levels

January 18, 2019 by James Woolley Leave a Comment

Previous Analysis

I have been looking at the price of both gold and the Dow Jones index in recent weeks because they have both been trading close to major resistance levels, and are therefore potentially worth shorting.

Since I wrote these two blog posts, nothing much as changed, particularly in the case of gold, but the Dow Jones has continued to move higher, and is now very close to the major resistance levels that I highlighted previously.

So I thought it would be a good idea to take another look at these two markets and make a prediction as to where they might be headed.

Please note that these are only my own personal opinions and do not in any way represent financial or trading advice of any kind.

Gold

I mentioned before that $1300 is acting as a major resistance level at the moment, and that still seems to be the case today:

Gold Price Chart - 18 January

At that time it was trading at $1283, but as you can see from the chart above, the price has slowly edged higher towards the $1300 level since then.

Nevertheless, it has once again stalled in the $1290s as the general stock markets have continued to rise, and as you can see from the chart above, the price has been trading in an ever decreasing triangle.

Therefore I personally think that it is only a matter of time before we see a breakout, and the likelihood is that it will be a downward one because of the continual round number resistance at $1300 and the tight price action.

So it wouldn’t be at all surprising if the price were to move back to around $1250-$1260, towards the 100 and 200-day moving averages, but if the price was to go back to $1300, it may also be worth opening a short here because I think this would be a fairly high probability set-up as well.

Dow Jones

As mentioned earlier, the Dow Jones has continued to recover from its December lows, and this isn’t really that surprising.

I said in a previous post that the price could easily continue moving higher and test its long-term moving averages, which at that time stood at 24,507 (EMA (100)) and 24,741 (EMA (200)), and at the time of writing, the price is now trading at 24,406 pre-market opening.

Dow Jones Chart - 18 January

Indeed it has just touched the EMA (100) yesterday and today, having risen sharply from a low of 21,454, so it is now looking seriously overbought and could now be ready to turn lower now that it has reached two major resistance levels (the EMA (200) is just 280 points higher).

As always, the market never gives you a clear signal that a top or a bottom has been reached, but with the price trading close to two key moving averages, I think it could be a good opportunity to open a short position if we get a pin bar on the daily chart or one of the lower time frames, for example, because this would also be a high probability set-up.

Filed Under: Analysis Tagged With: dow jones, gold, resistance

Crude Oil’s Price Move Highlights Profitability of Inside Bar Breakouts

January 10, 2019 by James Woolley 1 Comment

Inside Bar Breakouts

I have long argued that inside bar breakouts are some of the easiest and most predictable breakouts that you can trade.

All you need to do is wait for quite a large candle on the daily chart (or higher), and wait for a series of consecutive inside bars that all trade within the range of this initial candle.

Then once the price eventually closes above or below the initial candle, you can then enter a trade in the same direction, and profit from the momentum of the breakout.

Real Life Example – US Crude Oil

To demonstrate the effectiveness of this simple trading strategy, here is the daily chart of US crude oil that I posted on this website at the start of the month:

US Crude Oil Inside Bars - 1 January 2019

….. and this is what happened when the price finally closed outside of the range of the initial set-up candle:

US Crude Oil Breakout - January 2019

As you can see, there was initially a false breakout where the price moved above but failed to close above the initial candle, followed by a secondary breakout where the price did indeed close above this candle, and this would have been the time to enter a long position.

Once this happened, the price moved strongly higher and went straight to $50, which would have been a natural exit price, but it actually had the momentum to keep on moving higher, and currently stands at around $52.

It could potentially go higher as well because it is still quite a long way below both the 100 and the 200-day moving averages, as shown on the chart above.

Final Thoughts

So hopefully you can see that you don’t necessarily need to use lots of fancy indicators to come up with a winning strategy.

The simplest strategies are often the most profitable, and I always found that inside bar breakouts in particular are generally some of the most predictable and profitable breakouts that you can trade.

The only real drawback is that they don’t occur all that often. So you may have to wait patiently for a really good set-up to occur across all of the major forex pairs and commodities. Alternatively you can apply this strategy to some of the other markets that you like to trade, such as cryptocurrencies or ETFs, for example.

Filed Under: Analysis Tagged With: breakout, inside bar, oil, us crude

Dow Jones Analysis For January 2018 – How High Can It Go?

January 9, 2019 by James Woolley Leave a Comment

December Price Crash

Unless you have been living under a rock for the last few months, you will know that the Dow Jones (and all of the other major indices) completely collapsed last month, continuing on from the initial negativity in November.

The much anticipated Santa rally never really materialised in these panic-driven conditions, and many people will have spent Christmas looking at their depleted portfolios and seeing how much money they have lost on paper.

Despite all this, the markets have staged a recovery after we saw trade war tensions ease and received some positive assurances from the Fed, and they are now significantly higher than their previous lows.

I can certainly vouch for this because my new trading account on eToro (which you can follow or copy by searching for SteadyProfits on eToro) that I was unfortunate enough to open just before the crash, has recovered much of its losses in recent weeks.

The question that many people will be asking now is; how much higher can the Dow Jones go?

Future Price Move

I am not foolish enough to believe that all of the bad news is behind us. There is still a lot of uncertainty surrounding Brexit, there is a possible recession looming in Germany, and tech giants such as Samsung and Apple have warned that profits will be lower than forecast this quarter.

Therefore there could still be another downward wave of selling just around the corner. However as I discussed in yesterday’s post regarding the future gold price, there is still the potential for the markets to continue going a little higher in the near future.

Dow Jones Chart - 9 January 2018

Price Targets / Trading Opportunity

If it does continue to move higher, then the 100 and 200-day exponential moving averages are obvious targets because these are not much higher than today’s price, and are now within range.

The price has already breached the 200-period EMA on the 4-hour chart, but on the daily price chart shown above, it hasn’t even hit the 50-period EMA yet. So there is the potential for the price to move higher and test these key levels, which currently stand at:

  • EMA (100) = 24,507
  • EMA (200) = 24,741

With the price currently standing at 23,820, this represents a potential gain of at least 687 points, or 2.88%.

If it does hit the 100 or 200-day exponential moving average, the markets are likely to see this as a strong resistance level, and I wouldn’t be surprised if this was the start of a new downward price move.

Therefore in terms of a trading opportunity, I would probably be looking for a key reversal signal, such as a pin bar, for example, or divergence on a few key indicators before opening a short position around these key resistance levels.

However these are just my own thoughts and opinions, and it doesn’t represent professional financial or trading advice in any way.

Filed Under: Analysis Tagged With: dow jones

  • « Previous Page
  • 1
  • …
  • 7
  • 8
  • 9
  • 10
  • 11
  • …
  • 17
  • Next Page »

Forex Rebates:

Choose from 40+ different forex brokers and crypto exchanges, and get cashback every time you trade:


Copy Profitable Traders:

If you join ZuluTrade, you can follow and subscribe to profitable traders and all of their trades will be automatically copied in your own trading account.

You can also earn money as a signal provider if you are already a profitable trader.

Click here to find out more

Recommended Broker:

Recent Blog Posts:

  • High Probability Trade on S&P 500 – 26 January 2024
  • Oanda Moves Into Prop Trading With Labs Trader Program
  • My eToro Performance in 2023 – Up 33.24%
  • The5ers Offering $20K Bootcamp Challenge For Just $1
  • Example of VWAP Bounce Trade on S&P 500 – 18 December 2023

Recent Articles:

VWAP Indicator
  • MA Sabres (LuxAlgo) Indicator
  • 10 Harsh Truths About Forex Trading
  • Best Websites for Monitoring Currency Strengths
  • Xmaster Formula Indicator for MT4 and MT5
  • Tools:

    Currency Heat Map

    Categories

    • Analysis
    • News

    Archives

    • January 2024
    • December 2023
    • November 2023
    • October 2023
    • September 2023
    • August 2023
    • July 2023
    • June 2023
    • May 2023
    • August 2020
    • June 2020
    • May 2020
    • April 2020
    • January 2020
    • December 2019
    • November 2019
    • October 2019
    • September 2019
    • August 2019
    • July 2019
    • June 2019
    • May 2019
    • April 2019
    • March 2019
    • February 2019
    • January 2019
    • December 2018
    • November 2018
    • October 2018
    • September 2018
    • August 2018
    • July 2018
    • June 2018
    • May 2018
    • March 2016
    • December 2015
    • November 2015
    • October 2015
    • August 2015
    • July 2015

    Disclaimer

    This website should be used for general information purposes only and in no way represents professional financial advice.

    Forex and CFD trading carries a high level of risk and it is possible to lose more than your initial deposit if using leveraged products.

    Copyright © 2025 · eleven40 Pro Theme on Genesis Framework · WordPress · Log in

    • About
    • Contact
    • Disclosure
    • Privacy Policy
    • Terms Of Service