Introduction
Many forex traders will tend to focus all of their attention on the major forex pairs, such as the GBP/USD, EUR/USD and USD/JPY pairs, for example, but the oil markets can be just as profitable, if not more so, when day trading.
That’s because you can often get 200-300 point swings in a day, and there is generally lots of volatility during the London and New York trading sessions, which makes it easy to find one or two high quality set-ups.
One such set-up presented itself yesterday on US crude oil yesterday (19 May 2023), as I will now discuss in more detail.
Previous Price Action
Going in to Friday, I knew that Thursday had been an inside bar on the daily chart of US crude. Therefore I was expecting Friday to potentially be a more volatile day with a wider trading range.
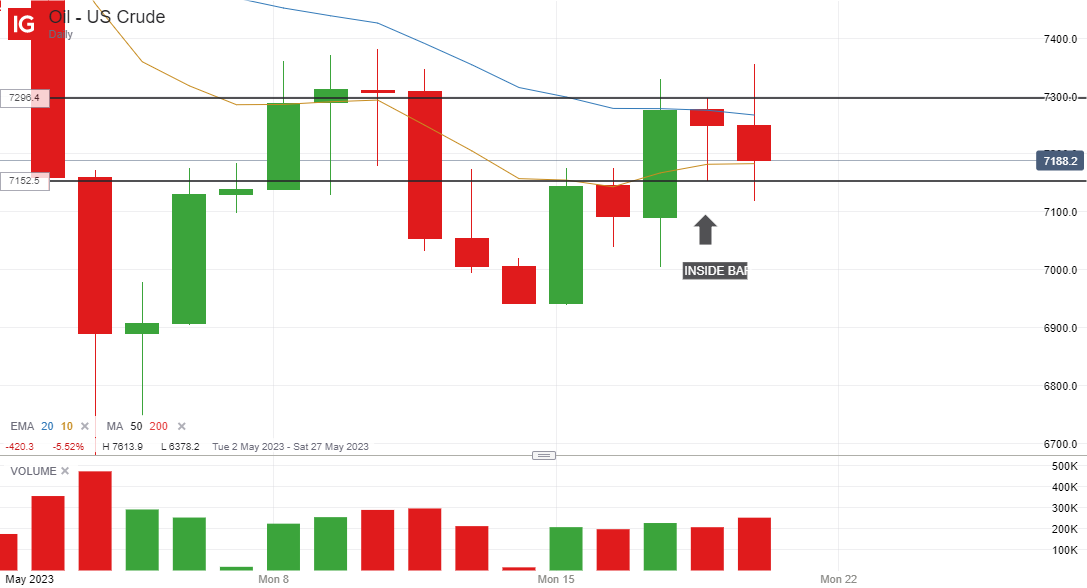
My bias was towards the downside because I was looking for the price to break below the Thursday low of this inside bar, and make a sustained move downwards to erase some of the upward momentum of Monday and Wednesday.
Early Morning Price Action
The low of the inside bar was $71.54, so this was the key level that I was looking at, but as you can see from the shaded rectangle that I drew on the chart, the price was trading in a narrow range during this time and was nowhere near this key level. Therefore a breakout was looking unlikely at this stage.
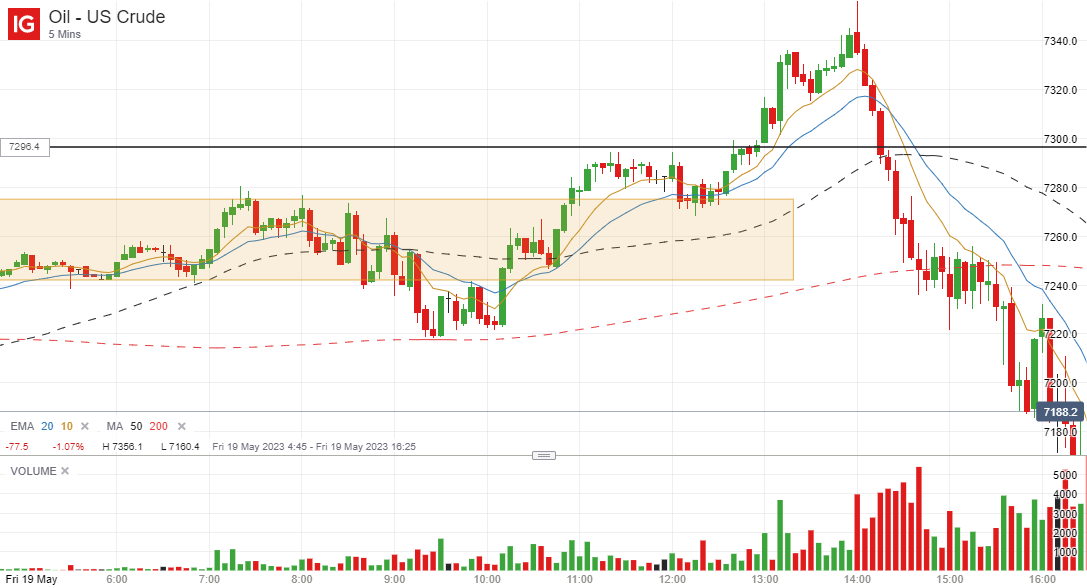
The price did break out of this channel at around 9.15 AM (London time) but was still around 70 points short of this key level even at the low. So it wasn’t really worth trading the breakout at this time.
Failed Breakout
This attempted breakout ultimately failed, and the price came back into the early morning trading range, before breaking upwards outside the high of this range.
When this happens, you have to accept that your bias towards the downside may be wrong, and it may be worth considering trading an upward breakout of the inside bar instead (which stood at $72.96).
Weekly Resistance and Inside Bar Breakout
Looking at the daily chart, I was aware that there was very strong resistance around the $73 level from Wednesday and Thursday, and indeed from previous days earlier in the month, and this was reflected in the price action because the upward momentum started to stall as it got towards this level.
I knew that we could get an attempted breakout into higher ground if we could stay within 20 or 30 points of this key level, and so when the large red candle on the 5 minute chart failed to result in a pullback, and instead started to trade in a very narrow range, it was time to sit up and take notice.
Taking the Trade
I have talked about 5-minute momentum trades on this site before, and how they can be very profitable in the right trading conditions, and this looked like being one of them.
The 10 and 20-period EMAs were now very close to each other on the 5-minute chart and this new trading range was sitting right on the high of the previous trading range.
It was just a case of watching the price action and waiting for a strong green bullish candle breaking upwards outside of this very narrow range.
Here is a zoomed in view of what happened…
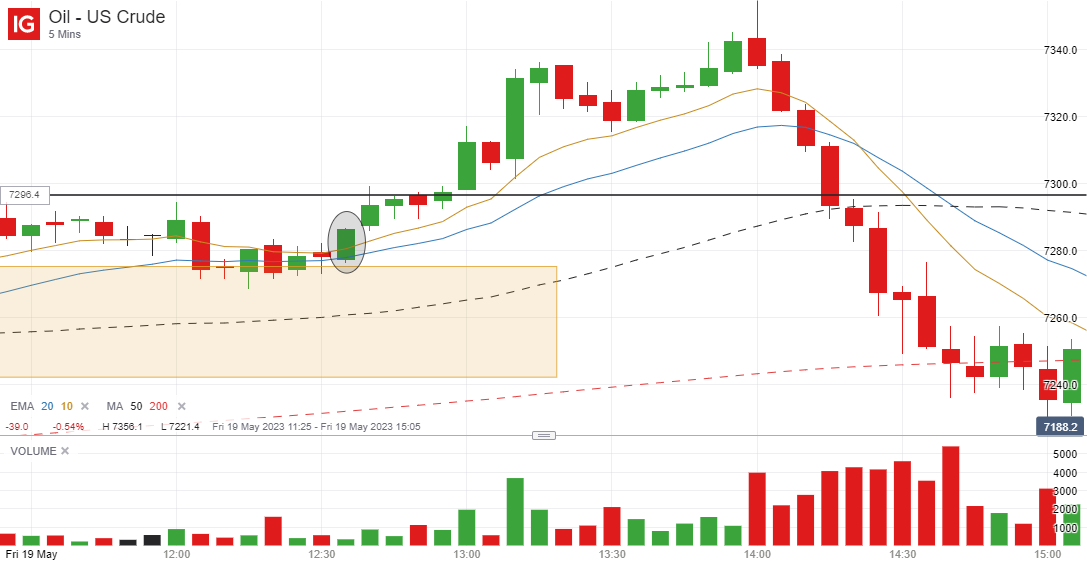
After two inside bars followed by a green breakout candle, I took a long position on the close of this candle at 72.87 with a stop under the previous candle low of 72.73.
My stop was therefore 14 points, and I was hoping for a profit of at least 2 times my risk, ie 28 points.
In the end I closed out my entire position at 73.25 for a profit of 38 points and a risk/reward trade of around 2.7 after I had moved my stop loss up to this level and was stopped out, which I was more than happy with.
I was hoping that the upward momentum would continue for a much bigger move, but even after I was stopped out, the price only reached a high of 73.56 and the breakout quickly fizzled out and reversed sharply later in the day as longer term traders banked their profits from previous longs earlier in the week.
Final Thoughts
The point of this article was not to brag about having a profitable trade on US crude oil yesterday (I have just as many losing trades as winning trades, just like most traders), but merely to walk you through my thought process regarding this potential set-up, and to demomnstrate the profit potential of these momentum trades from tight trading ranges on the 5-minute chart.
These high probability set-ups don’t come around that often each day, but you need to keep an eye out for them because they can be fairly profitable when they do come along, and because the price is breaking out of a narrow range, you can keep your stop losses small and go for bigger wins of 2 or 3 times your risk, which are the trades that we all want to find.

Leave a Reply