December Price Crash
Unless you have been living under a rock for the last few months, you will know that the Dow Jones (and all of the other major indices) completely collapsed last month, continuing on from the initial negativity in November.
The much anticipated Santa rally never really materialised in these panic-driven conditions, and many people will have spent Christmas looking at their depleted portfolios and seeing how much money they have lost on paper.
Despite all this, the markets have staged a recovery after we saw trade war tensions ease and received some positive assurances from the Fed, and they are now significantly higher than their previous lows.
I can certainly vouch for this because my new trading account on eToro (which you can follow or copy by searching for SteadyProfits on eToro) that I was unfortunate enough to open just before the crash, has recovered much of its losses in recent weeks.
The question that many people will be asking now is; how much higher can the Dow Jones go?
Future Price Move
I am not foolish enough to believe that all of the bad news is behind us. There is still a lot of uncertainty surrounding Brexit, there is a possible recession looming in Germany, and tech giants such as Samsung and Apple have warned that profits will be lower than forecast this quarter.
Therefore there could still be another downward wave of selling just around the corner. However as I discussed in yesterday’s post regarding the future gold price, there is still the potential for the markets to continue going a little higher in the near future.
Price Targets / Trading Opportunity
If it does continue to move higher, then the 100 and 200-day exponential moving averages are obvious targets because these are not much higher than today’s price, and are now within range.
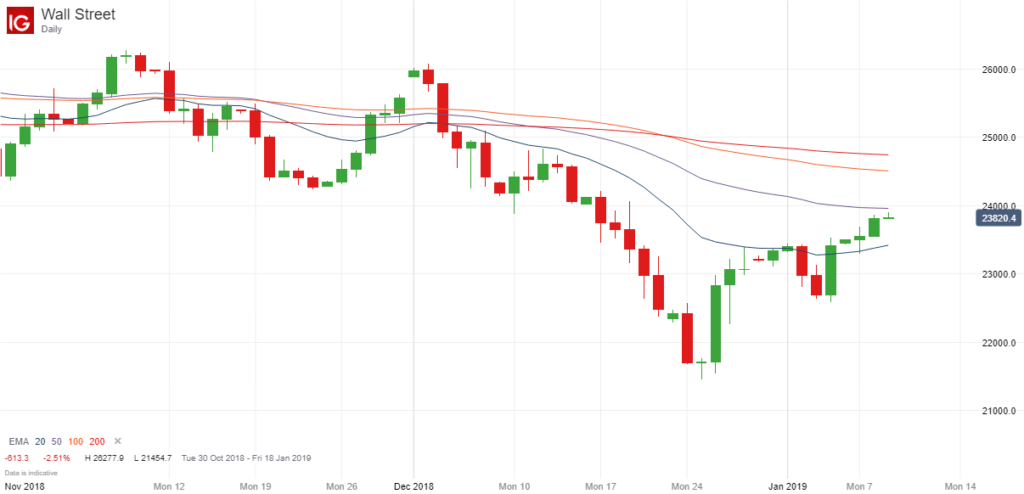
The price has already breached the 200-period EMA on the 4-hour chart, but on the daily price chart shown above, it hasn’t even hit the 50-period EMA yet. So there is the potential for the price to move higher and test these key levels, which currently stand at:
- EMA (100) = 24,507
- EMA (200) = 24,741
With the price currently standing at 23,820, this represents a potential gain of at least 687 points, or 2.88%.
If it does hit the 100 or 200-day exponential moving average, the markets are likely to see this as a strong resistance level, and I wouldn’t be surprised if this was the start of a new downward price move.
Therefore in terms of a trading opportunity, I would probably be looking for a key reversal signal, such as a pin bar, for example, or divergence on a few key indicators before opening a short position around these key resistance levels.
However these are just my own thoughts and opinions, and it doesn’t represent professional financial or trading advice in any way.

Leave a Reply