The Forex Chronicles

  • Rebates
  • Brokers
  • News
  • Analysis
  • Signals
    • Best Copy / Social Trading Platforms
    • eToro Review
    • FXTM Invest Review
    • Marketclub Review
    • ZuluTrade Review
  • Indicators
  • Strategies
  • Articles

Dow Jones Analysis – Positive Divergence Hints at Santa Rally

December 19, 2018 by James Woolley Leave a Comment

December Price Falls

December is usually quite a good month for stock market traders and investors, but this has apparently been the 2nd worst December on record.

The leading stock market indices have all fallen sharply and there are many reasons why. Brexit, interest rate rises, trade tariffs and the threat of a possible recession have all weighed heavily on the indexes this month.

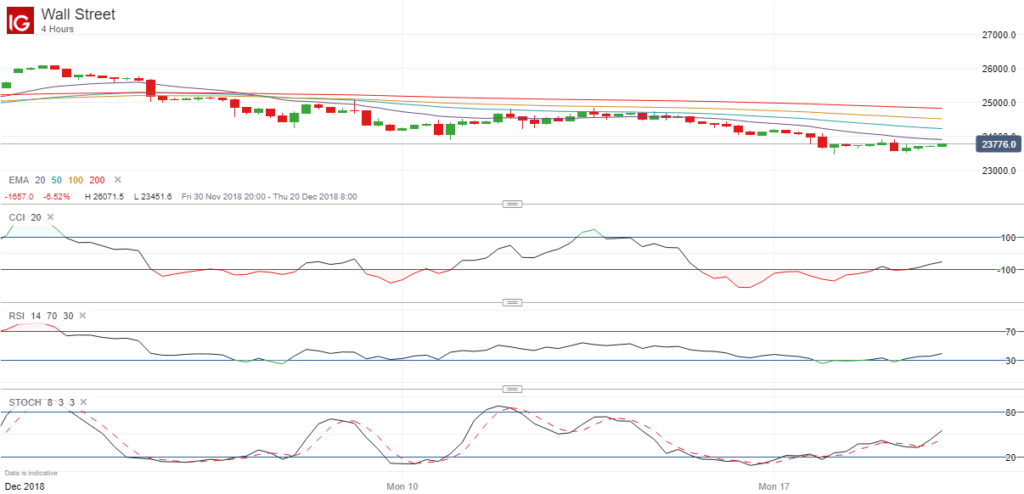
As a result of this, many people have given up on the idea that there will be a Santa rally this year, but looking at the 4-hour chart of the Dow Jones, there is still hope:

Dow Jones Positive Divergence - December 2018

Positive Divergence

As you can see, the price has recently been posting new lows, but if you look at three of the leading technical indicators, you will notice that there has been positive divergence on each of these indicators.

In other words, as the price has posted new lows, the CCI, RSI and Stochastics indicators have all failed to post new lows, and have actually been trading higher, which suggests that the downward move is running out of momentum.

Future Price Move

This positive divergence suggests that the price is likely to move higher in the coming days, but it should always be emphasized that these are all just indicators. The price could easily turn lower and start a new downward wave.

However with just 4 trading sessions left before Christmas, my own view is that we will still see a Santa rally this year, which could then continue until the New Year, as it so often does.

Therefore a price of 24,000 would be my first target, which should easily be achieved if there is such a rally, and looking further ahead, I wouldn’t be surprised it the price went back to the EMA (100) on this time frame, which is currently around 24,500. This would result in a rise of around 3% from the current price level.

As always, these are just my own thoughts and predictions. This in no way represents professional trading or financial advice. You should always do your own research before entering any positions in the markets.

Filed Under: Analysis Tagged With: divergence, dow jones, santa rally

Leave a Reply Cancel reply

Your email address will not be published. Required fields are marked *

Forex Rebates:

Choose from 40+ different forex brokers and crypto exchanges, and get cashback every time you trade:


Copy Profitable Traders:

If you join ZuluTrade, you can follow and subscribe to profitable traders and all of their trades will be automatically copied in your own trading account.

You can also earn money as a signal provider if you are already a profitable trader.

Click here to find out more

Recommended Broker:

Recent Blog Posts:

  • High Probability Trade on S&P 500 – 26 January 2024
  • Oanda Moves Into Prop Trading With Labs Trader Program
  • My eToro Performance in 2023 – Up 33.24%
  • The5ers Offering $20K Bootcamp Challenge For Just $1
  • Example of VWAP Bounce Trade on S&P 500 – 18 December 2023

Recent Articles:

VWAP Indicator
  • MA Sabres (LuxAlgo) Indicator
  • 10 Harsh Truths About Forex Trading
  • Best Websites for Monitoring Currency Strengths
  • Xmaster Formula Indicator for MT4 and MT5
  • Tools:

    Currency Heat Map

    Categories

    • Analysis
    • News

    Archives

    • January 2024
    • December 2023
    • November 2023
    • October 2023
    • September 2023
    • August 2023
    • July 2023
    • June 2023
    • May 2023
    • August 2020
    • June 2020
    • May 2020
    • April 2020
    • January 2020
    • December 2019
    • November 2019
    • October 2019
    • September 2019
    • August 2019
    • July 2019
    • June 2019
    • May 2019
    • April 2019
    • March 2019
    • February 2019
    • January 2019
    • December 2018
    • November 2018
    • October 2018
    • September 2018
    • August 2018
    • July 2018
    • June 2018
    • May 2018
    • March 2016
    • December 2015
    • November 2015
    • October 2015
    • August 2015
    • July 2015

    Disclaimer

    This website should be used for general information purposes only and in no way represents professional financial advice.

    Forex and CFD trading carries a high level of risk and it is possible to lose more than your initial deposit if using leveraged products.

    Copyright © 2025 · eleven40 Pro Theme on Genesis Framework · WordPress · Log in

    • About
    • Contact
    • Disclosure
    • Privacy Policy
    • Terms Of Service