The Forex Chronicles

  • Rebates
  • Brokers
  • News
  • Analysis
  • Signals
    • Best Copy / Social Trading Platforms
    • eToro Review
    • FXTM Invest Review
    • Marketclub Review
    • ZuluTrade Review
  • Indicators
  • Strategies
  • Articles

EUR/USD Analysis – The Power of Pin Bars and Inside Bars

October 5, 2018 by James Woolley Leave a Comment

Introduction

The EUR/USD pair traded in a sideways trading range for much of the summer, but suddenly burst into life in August when the price broke out to the downside.

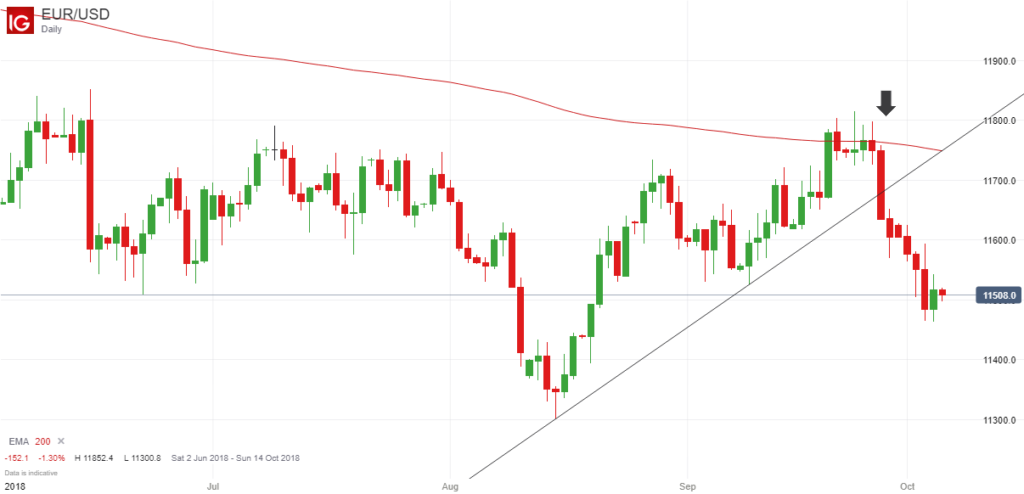
It eventually found support at 1.1300 and came back into the previous trading range, before heading higher to touch the 200-day exponential moving average, which would have been an obvious exit point for many traders who had opened long positions prior to this.

This key moving average then acted as resistance and the price broke below the trendline that indicated the upward trend in August and September, and has continued drifting lower ever since.

EURUSD Price Chart - October 2018

Importance of Pin Bars, Inside Bars, Trendlines and EMA (200)

The real point that I wanted to get across in this article is that if you combine some of the most trusted candlestick patterns with trendlines and key areas of support and resistance, you can get some very powerful trading signals.

That’s exactly what we had with this pair because if you look at the daily price chart of the EUR/USD pair above, you can see all of these things combined to form a powerful reversal signal, and a clear signal to go short.

First of all, the price hit the EMA (200), and if you look at the subsequent price action, you can see that the price struggled to close above this key level.

Secondly, you can see that there was a clear pin bar where the price opened below the EMA (200) and surged higher above 1.1800 during the day’s session, but lacked momentum and dropped back to around its opening price, which was another key signal.

Thirdly, in the few days after this pin bar had formed, the two daily candles traded within the range of the pin bar and both had small bodies, which again indicated a reluctance to take the price higher.

Finally, the price broke below the range of the pin bar (which would have been the perfect time to open a short position), and if you were late to the party, you would have seen that this pair closed below the trendline, which would have given you another good opportunity to open a short position.

The price is now back at around the 1.1500 level. So even if you had entered late, you could have banked up to 170 points so far, which is obviously an excellent return.

Closing Comments

The point is that pin bars, inside bars, key resistance levels and breaks of trendlines are all powerful reversal signals all by themselves, but when they all combine to give the same signal, you end up with a really high probability set-up that is much more likely to be successful.

So it is always worth scanning through the various forex pairs to look for these ultra-strong signals because although they don’t necessarily occur that often, they can be very profitable when they do.

Filed Under: Analysis Tagged With: eurusd, inside bar, pin bar, trendline

Leave a Reply Cancel reply

Your email address will not be published. Required fields are marked *

Forex Rebates:

Choose from 40+ different forex brokers and crypto exchanges, and get cashback every time you trade:


Copy Profitable Traders:

If you join ZuluTrade, you can follow and subscribe to profitable traders and all of their trades will be automatically copied in your own trading account.

You can also earn money as a signal provider if you are already a profitable trader.

Click here to find out more

Recommended Broker:

Recent Blog Posts:

  • High Probability Trade on S&P 500 – 26 January 2024
  • Oanda Moves Into Prop Trading With Labs Trader Program
  • My eToro Performance in 2023 – Up 33.24%
  • The5ers Offering $20K Bootcamp Challenge For Just $1
  • Example of VWAP Bounce Trade on S&P 500 – 18 December 2023

Recent Articles:

VWAP Indicator
  • MA Sabres (LuxAlgo) Indicator
  • 10 Harsh Truths About Forex Trading
  • Best Websites for Monitoring Currency Strengths
  • Xmaster Formula Indicator for MT4 and MT5
  • Tools:

    Currency Heat Map

    Categories

    • Analysis
    • News

    Archives

    • January 2024
    • December 2023
    • November 2023
    • October 2023
    • September 2023
    • August 2023
    • July 2023
    • June 2023
    • May 2023
    • August 2020
    • June 2020
    • May 2020
    • April 2020
    • January 2020
    • December 2019
    • November 2019
    • October 2019
    • September 2019
    • August 2019
    • July 2019
    • June 2019
    • May 2019
    • April 2019
    • March 2019
    • February 2019
    • January 2019
    • December 2018
    • November 2018
    • October 2018
    • September 2018
    • August 2018
    • July 2018
    • June 2018
    • May 2018
    • March 2016
    • December 2015
    • November 2015
    • October 2015
    • August 2015
    • July 2015

    Disclaimer

    This website should be used for general information purposes only and in no way represents professional financial advice.

    Forex and CFD trading carries a high level of risk and it is possible to lose more than your initial deposit if using leveraged products.

    Copyright © 2025 · eleven40 Pro Theme on Genesis Framework · WordPress · Log in

    • About
    • Contact
    • Disclosure
    • Privacy Policy
    • Terms Of Service