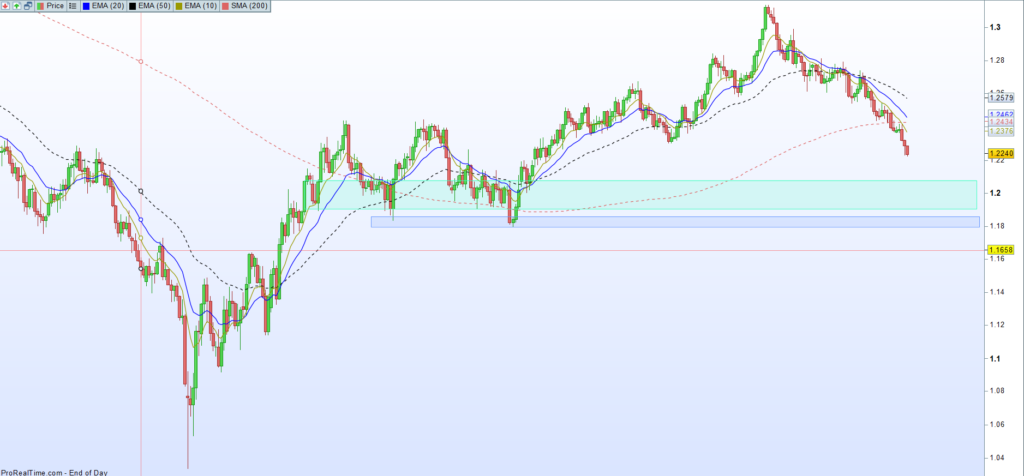
GBP/USD Weakness
With the Bank of England keeping interest rates on hold this week after better than expected inflation numbers, it is no surprise that the British pound has been selling off hard.
Higher interest rates attract overseas investment, and so by indicating that interest rates possibly may have peaked, or at least kept on hold for a while, the pound has now become a lot less attractive.
As a result, the GBP/USD has dropped to 1.2237, having traded as high as 1.3143 back in July, and has seen a 3-day drop of nearly 200 pips.
Therefore many traders will now be asking themselves if the GBP/USD is close to a bottom and potentially ripe for taking a long position, or whether it still has further to fall.
Possible Support Level
One thing I will say is that it is very dangerous to try to catch a falling knife. If a market is trending strongly downwards, it has a lot of momentum behind it. So diving in with a long position when you think that it may have fallen too far is often a losing strategy.
The popular oscillating indicators, such as the RSI and stochastics, are all indicating that the GBP/USD pair is oversold on the daily chart, but they were also oversold when the GBP/USD was 200 pips higher last week, so it is foolish to rely on these indicators alone.
You really need to look to the left of the chart and look for possible support levels on the chart because this will indicate areas of support where sellers are likely to exit their positions and buyers are likely to step in.
In the case of the GBP/USD pair, there is a lot of price action between 1.19 and 1.21 so this is a good support zone, and there are double bottom lows from January and March at 1.1841 and 1.1803 that should act as strong support levels, as you can see below:

Trading Idea
Anyone thinking of taking a longer term long position may therefore want to start scaling in between 1.19 and 1.20 (the lower half of the support zone), adding positions down to the previous double bottom lows of 1.1803, with a stop loss somewhere below 1.18.
If the price breaks through the previous lows of 1.18, this would break the thesis of the trade, and you would really want to get out fairly quickly because there is clear air on the chart until the next arwa of support around 1.1150.
I should emphasize that this is just a trading idea and not financial advice of any kind.
Final Thoughts
I myself like to trade potential reversals on a shorter term basis, waiting for times when the price is extremely oversold on the 1-hour, 4-hour and daily timeframes and hitting key support levels. Then I will start to scale into positions.
So I will be waiting for potential set-ups tomorrow and later on in the week.
If the GBP/USD could get down to previous levels of support around 1.18 – 1.20, and is down 1 daily ATR or more on the day, that for me would be a great set-up.

Leave a Reply