Introduction
With the major stock markets surging higher in 2019, I think many people naturally assumed that the price of gold would struggle to stay above $1300. I know I certainly did because I made this exact point in previous blog posts.
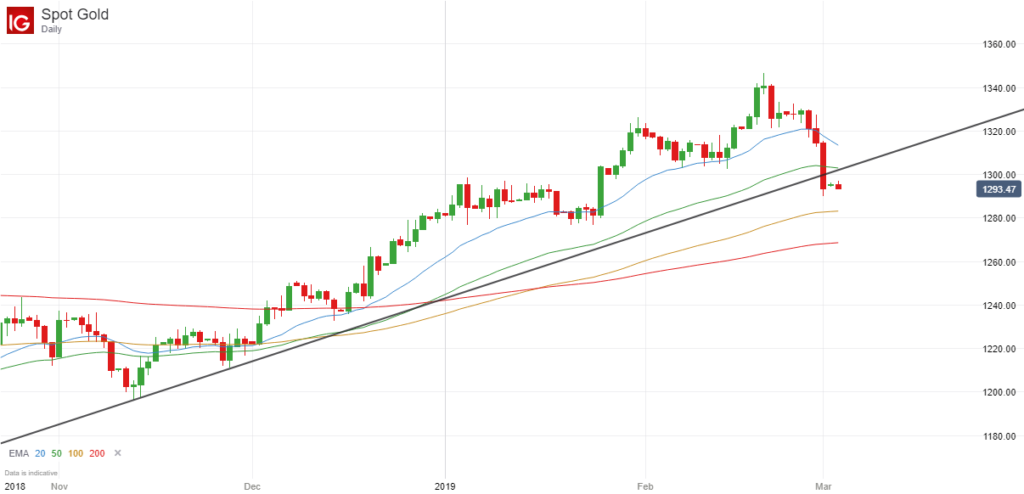
Well it has taken a while because the price of gold headed to around $1345 a few weeks ago, but it has since fallen back sharply and is now trading below $1300 at around $1293.5 at the time of writing.
Indeed this was apparently the biggest weekly decline since August 2018, which shows just how strong a move this actually was last week.
It is not an insignificant move either because if you look at the long-term daily chart below, you can see that it has broken below the upward trendline that has been in place since November last year:

The question is; where does it go from here?
Future Price Direction
It is actually very difficult to call this market right now because it largely depends on what the stock markets do in the coming weeks, and these too are difficult to call.
With Britain scheduled to leave the European Union at the end of this month, and Donald Trump’s comments and actions continuing to weigh heavily on the markets, nobody can really be sure if the markets are going to continue to move higher in the future, or whether they will finally start to run out of momentum and fall back.
Brexit alone is causing so much uncertainty because it is looking increasingly unlikely that there will be a firm resolution before the official exit date, and the USA’s future relationship with China and other countries isn’t any clearer.
So all we can really do is to rely on technical analysis to guide us with regards to the gold price, and in that respect you would have to say that gold may well struggle to break back above the $1300 level now that it has broken below this significant round number.
Looking further ahead, further weakness is likely and I would say that there is every chance that the price will move towards the 200-day exponential moving average at some point, which currently stands at around $1268.
Trading Opportunity
Although I am predicting further weakness below $1300, I wouldn’t necessarily say that this is a strong trading opportunity right now because it doesn’t really represent a high-probability trade.
With gold and other commodities, I think it is better to wait for a period of consolidation where the markets are range-bound for several weeks, and then trade the resulting breakout, similar to what we saw at the January when the price rocketed above $1300 after several weeks of sideways movement.
So it is probably better to wait and see if the price stays around the 1290-1300 level for several days because if this occurs, then a downward breakout could be a very profitable trade.

Leave a Reply