The Forex Chronicles

  • Rebates
  • Brokers
  • News
  • Analysis
  • Signals
    • Best Copy / Social Trading Platforms
    • eToro Review
    • FXTM Invest Review
    • Marketclub Review
    • ZuluTrade Review
  • Indicators
  • Strategies
  • Articles

MACD Divergence on the EUR/CHF Pair in 2019

June 11, 2019 by James Woolley Leave a Comment

Introduction to MACD Divergence

The MACD indicator has always been one of the most widely used technical indicators because it tends to follow the trend and the general price movement of a particular market very well, and can be very effective at indicating a change of trend when the two lines cross.

Furthermore, when you combine the MACD indicator with the MACD histogram, you can get some very powerful signals on occasions.

One of the most powerful signals is when the price of a particular market is making new highs, or is making two or more peaks at the end of an upward trend, for example, but both the MACD and the MACD histogram are failing to make new highs.

This will often indicate that the trend is running out of momentum, and it might be worth opening a short position on any big downward price move or any real sign of a reversal.

Real Life Example on the EUR/CHF Pair

If you take a look at the daily price chart of the EUR/CHF pair below, you will see that we had a classic MACD divergence pattern on this particular pair in April and May:

EURCHF MACD Divergence in April and May

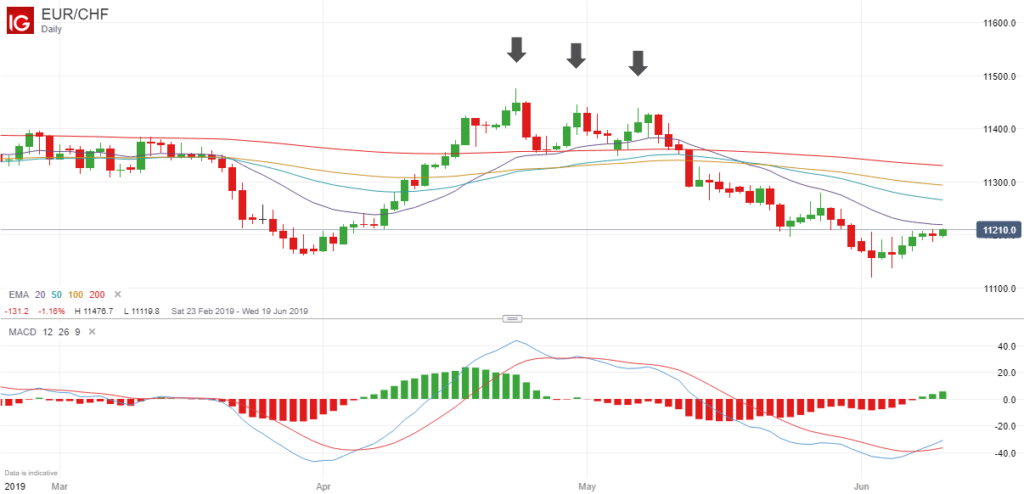
The three arrows on the chart indicate the peaks at the top of the upward price trend, and you can see that on each peak both the MACD and the MACD histogram failed to make new highs.

Therefore when the price failed to make another new high and actually moved strongly below the 200-day exponential moving average (indicated by the red line), this would have been a good opportunity to open a short position.

As I always say, you always want to be trading when the odds are firmly in your favour, and when you get a strong MACD divergence pattern like this one, this is a good example of a high probability trade.

If you had entered a short position on the closing breakout candle at around 1.1290, you could have made up to 170 points before there was a reversal.

A Word of Caution

I want to finish by saying that you sometimes need to be careful when looking for divergence patterns, and should only look for the very best set-ups.

Staying with the EUR/CHF pair, the price continued moving downwards, and you can see that there was divergence on the MACD histogram once again, indicating that the new downward trend may have been running out of momentum, but the MACD indicator continued to make new lows, so this would have been a more risky trade.

Indeed you would actually have lost money if you had gone long on the MACD histogram divergence alone, which is why it is better to wait for divergence on both the MACD indicator and MACD histogram when trading forex pairs or any other markets.

Filed Under: Analysis Tagged With: divergence, eurchf, MACD

Leave a Reply Cancel reply

Your email address will not be published. Required fields are marked *

Forex Rebates:

Choose from 40+ different forex brokers and crypto exchanges, and get cashback every time you trade:


Copy Profitable Traders:

If you join ZuluTrade, you can follow and subscribe to profitable traders and all of their trades will be automatically copied in your own trading account.

You can also earn money as a signal provider if you are already a profitable trader.

Click here to find out more

Recommended Broker:

Recent Blog Posts:

  • High Probability Trade on S&P 500 – 26 January 2024
  • Oanda Moves Into Prop Trading With Labs Trader Program
  • My eToro Performance in 2023 – Up 33.24%
  • The5ers Offering $20K Bootcamp Challenge For Just $1
  • Example of VWAP Bounce Trade on S&P 500 – 18 December 2023

Recent Articles:

VWAP Indicator
  • MA Sabres (LuxAlgo) Indicator
  • 10 Harsh Truths About Forex Trading
  • Best Websites for Monitoring Currency Strengths
  • Xmaster Formula Indicator for MT4 and MT5
  • Tools:

    Currency Heat Map

    Categories

    • Analysis
    • News

    Archives

    • January 2024
    • December 2023
    • November 2023
    • October 2023
    • September 2023
    • August 2023
    • July 2023
    • June 2023
    • May 2023
    • August 2020
    • June 2020
    • May 2020
    • April 2020
    • January 2020
    • December 2019
    • November 2019
    • October 2019
    • September 2019
    • August 2019
    • July 2019
    • June 2019
    • May 2019
    • April 2019
    • March 2019
    • February 2019
    • January 2019
    • December 2018
    • November 2018
    • October 2018
    • September 2018
    • August 2018
    • July 2018
    • June 2018
    • May 2018
    • March 2016
    • December 2015
    • November 2015
    • October 2015
    • August 2015
    • July 2015

    Disclaimer

    This website should be used for general information purposes only and in no way represents professional financial advice.

    Forex and CFD trading carries a high level of risk and it is possible to lose more than your initial deposit if using leveraged products.

    Copyright © 2025 · eleven40 Pro Theme on Genesis Framework · WordPress · Log in

    • About
    • Contact
    • Disclosure
    • Privacy Policy
    • Terms Of Service