Introduction
FOMC weeks are always a lot of fun for indices traders because you can pretty much guarantee that there will be a lot of volatility after the interest rate announcement and the subsequent comments from Jerome Powell, and this week was no exception.
Although an interest rate rise of 0.25% was announced on Wednesday, as expected, we still saw some big price swings in the markets on Thursday and Friday, and I think yesterday’s price action in particular will have surprised a lot of traders.
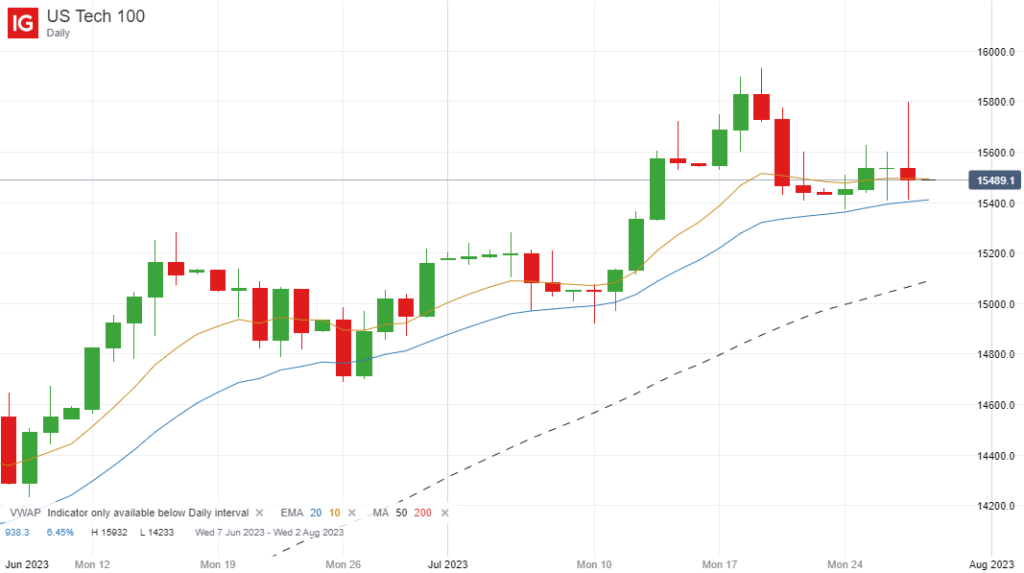
Nasdaq Chart After Thursday

If you look at the price chart of the Nasdasq 100 after Thursday’s close, you will see that the price rallied up to around the 15,800 level early in the trading session before dropping all the back to 15,413 towards the end of the session, creating a very bearish shooting star-type candlestick on the daily chart.
It also closed just below the EMA (10) on the daily chart, which is a slightly bearish signal in itself, and was now trading fairly close to the more significant EMA (20) at around 15,400.
Therefore it was natural to assume that after seeing the price reversing sharply on the day, and with the price now trading close to the shorter term EMA’s that so often signal a change in trend when they are both breached, Friday was likely to be a continuation drive lower and the bullish trend may be coming to an end, in the short term at least.
However the Nasdaq, and the markets in general, had other ideas…
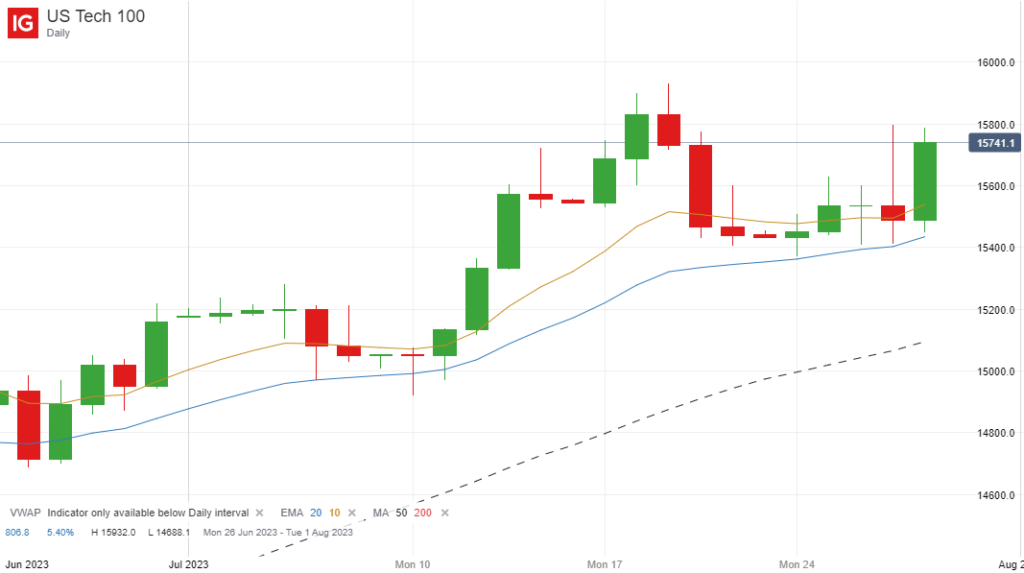
Nasdaq Chart After Friday

As you can see, after Thursday’s reversal, the price started to bounce back pre-market in the London session, and continued to move higher when the markets opened at 2.30 PM (UK time), closing the day and the week around 15,741.
So Friday ended up being a large inside bar, and the price reversed nearly all of the downward movement that we experienced from Thursday’s high, which just demonstrates how strong the markets are right now, and why it is foolish for bears to countertrend these markets at the moment.
When to Short the Nasdaq 100
I obviously cannot provide trading or financial advice on this blog, but if I personally was looking to short this particular index, I would be waiting for the price to close below the 20-day moving average.
Even then I wouldn’t be rushing in to enter a short straight away. I would prefer to wait for a breakout and then a retest, followed by a continuation move lower.
Final Thoughts
Overall, though, I still think the markets are still too strong to consider countertrending them, particularly after seeing Friday’s very bullish price action.
Although I think we are due a small correction at some point, we are getting towards the peak of the interest rate cycle, company earnings are coming in stronger than expected and if predictions of a minor recession (or no recession at all) are true, it is hard to see too many downward catalysts that are going to drive the markets significantly lower from here, other than a big escalation in war activities outside of the US.

Leave a Reply