Bitcoin Trading
Bitcoin has always been a popular instrument for long-term buy and hold investors because many people see the long-term value of this particular cryptocurrency, and believe that it will be trading a lot higher in the years to come.
However it has also become a very popular market for short and medium-term traders to trade because many people have found that it follows similar patterns as the more conventional trading instruments (stocks, indices, commodities, etc), and works really well with technical analysis.
So with that in mind, I want to offer my latest analysis of Bitcoin’s recent price action, and highlight why it may be set for a possible breakout in the near future.
Recent Price Action
As you can see from the price chart below, the price has been trading within a descending triangle for much of 2020.
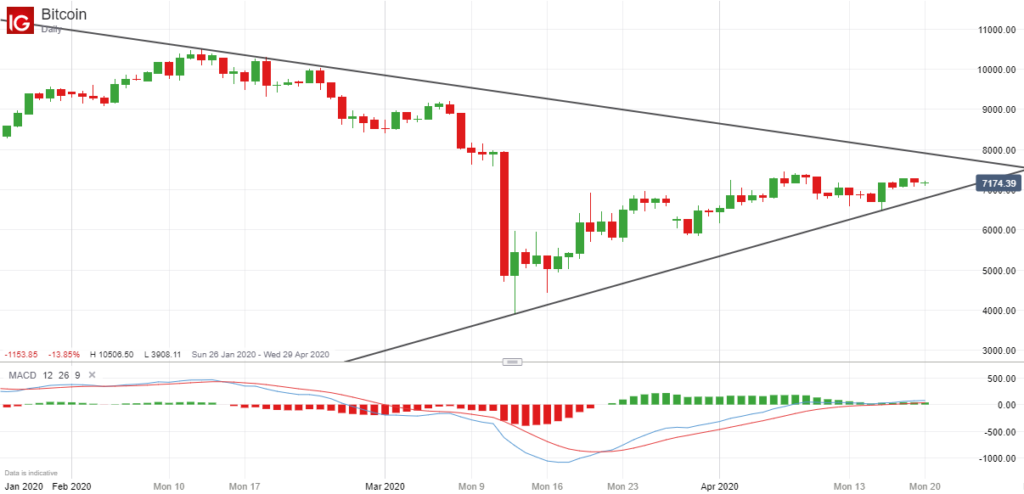
It reached a high of around $10,500 back in February, and posted a low of around $3900 on 13 March 2020, after losing approximately half its value in just two days of relentless selling.
Since hitting that low point, the price has been slowly trending upwards, trading just above $7000, and now seems to be somewhat stuck in a sideways trading range, undecided about which direction to take.
Possible Breakout
This indecisiveness, combined with the descending triangle pattern, suggests to me that we may be about to see a significant breakout once the price breaks decisively out of this triangle.
At the moment it is hard to see the price of Bitcoin breaking strongly upwards because if you look at a few other indicators, you can see that this upward price movement is starting to run out of momentum.
For example, there is divergence on both the MACD and MACD histogram indicators, and both are looking like they might be about to cross downwards, indicating the start of a new downward trend.
If the price were to break below the psychologically important 7000 level, and then close below the lower trendline of the descending triangle, ie below 6900, then it could easily fall back to the 6000 level in a short space of space, and possibly as low as 5000 over time if this breakout gathers momentum.
If, on the other hand, it could move as high as 8000 and break decisively upwards out of this triangle, then it wouldn’t be at all surprising to see it reach 9000 or 10,000 once again, but in this economic climate, this seems unlikely in my opinion.
Final Thoughts
It’s important to point out that these are just my own thoughts and opinions, and is not intended to be financial advice. It’s perfectly possible that there could be a false breakout and the price remains range-bound for the foreseeable future.
However it is still interesting to see how these descending triangles unwind because they will often end with a significant price move upwards or downwards, and with so much sideways price action in recent weeks, that may well happen here with Bitcoin.
You can be sure that many other traders and investors are waiting for some kind of breakout, so as is so often the case, it may become a self-fulfilling prophecy once traders jump on board and trade the resulting breakout as soon as it occurs. Stay tuned.

Leave a Reply