Introduction
STARC stands for Stoller Average Range Channels and is named after the developer of this indicator, Manning Stoller.
The STARC bands indicator is based on volatility and is designed to show upper and lower bands in a clearly defined channel based on an ATR multiple of a simple moving average (indicated by the middle line).
The price should stay within this channel around 90% of the time (or more) when the right settings are applied, and so it will indicate when the price is out of balance and therefore potentially overbought when it is above or close to the upper band, or oversold when it has moved below or close to the lower band.
Because the bands widen when a market becomes more volatile and narrow during periods of low volatility, you can also use this indicator to identify the start of a new trend when volatility increases and the price moves outside of one of these bands.
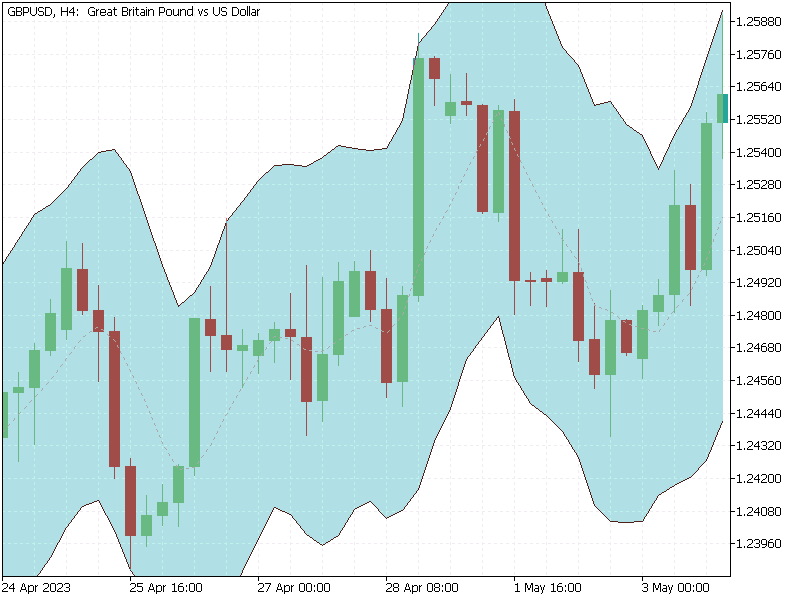
(source = MT5)
Best STARC Bands Settings
If you add this STARC Bands indicator to your charts, you will notice that there are various different settings that you can customize.
So you may wish to play around with these settings to suit your own trading strategy and the markets that you like to trade, but from my research and from my own testing, the following settings seem to work quite well for determining when markets are overbought or oversold:
- STARC main period = 6
- ATR period = 15
- ATR multiple = 2
- Moving average = simple moving average (SMA)
You may find that some versions of this indicator will allow you to change the type of moving average that is used as well. Therefore you could also experiment with an exponential, smoothed or linear moving average, for example, to see if this gives you some more reliable signals.
STARC Bands Formula
The STARC bands formula is based on the settings above and is calculated as follows:
Upper band = SMA + (ATR x multiplier)
Lower band = SMA – (ATR x multiplier)
STARC Bands Trading Strategies
Stoller average range channels are most commonly used to highlight areas of support and resistance and overbought and oversold conditions when the upper and lower bands are breached.
Therefore most STARC band trading strategies will involve going long when the price is below the lower band, and closing the trade when the price reverses and hits the upper band, and vice versa for short trades.
Some people also like to trade these reversals but prefer to close the position when the price comes back to the simple moving average line rather than wait for a full reversal to the other band.
It’s quite a risky strategy to use these STARC bands in isolation because sometimes the price can breach one of these bands and just keep on going when the trend is strong.
So it is often a better strategy to use these bands in conjunction with an oscillating indicator such as RSI or stochastics, for example, for additional confirmation of a trend reversal, or look for occasions where a band has been breached and the price is also close to a pivot point or a key high or low, for instance.
What is the Difference Between STARC Bands and Bollinger Bands?
It’s true that this indicator is quite similar to bollinger bands, but the key difference is that bollinger bands are based on standard deviations of the simple moving average whereas STARC bands are based on average true range multiples of the SMA.
What is the Difference Between STARC Bands and Keltner Channels?
Both of these indicators are based on the average true range, but the key difference here is that Keltner channels use an exponential moving average instead of a simple moving average, and generally use a higher period of 20.
In addition, an upward break of a Keltner channel is often seen as a bullish signal rather than a potentially overbought signal in the case of STARC bands.
Drawbacks
The main drawback of the STARC bands technical indicator is that although it will often highlight the high or the low point with great accuracy when the upper or lower line is taken out, and generate highly profitable reversal trades as a result, it can also result in some sharp losses when the price continues to move further outside the upper or lower band and stays outside the band with each new bar in a strong trend.
Therefore you cannot simply look to trade reversals every time one of the upper or lower limits is breached because this is unlikely to be profitable in the long run.
You may have to use other indicators or key support or resistance levels on the chart for additional confirmation, or look for certain candlestick formations at these extreme levels, such as pin bars or engulfing candles, for example.
Another slight drawback is that there may be times when the price will remain within the upper and lower bands for extended periods of time, which means that anyone trading with this indicator won’t be able to find any good set-ups.
Final Thoughts
I myself have tried using the STARC bands indicator when day trading the lower time frames, and although I did manage to find some very profitable set-ups on occasions where the price went from outside the upper band all the way down to the lower band, and vice versa for long trades, I actually ended up removing it from my charts.
The reason why is because I predominantly trade price action and I was finding that the STARC indicator would often persuade me not to take some of my regular set-ups if the price was in the middle of the channel, for example, and therefore it was costing me money.
Plus I couldn’t rely on it to give strong reversal signals if the trend ended up being overwhelmingly strong, which it often was.
Anyway that’s just my own experience, and I’m not definitely not going to advise people not to use it. I know from reading various forums that there are people that have built profitable systems around this STARC bands indicator, so it’s worth playing around with this indicator to see if it might potentially work for you.
STARC Bands Indicator for MT4 / MT5
If you would like to download this indicator and add it to your charts, you can download it from the links below:
https://indicatorspot.com/indicator/starc-bands-indicator/ (MT4)
https://www.mql5.com/en/code/16864 (MT5)

Leave a Reply