The Forex Chronicles

  • Rebates
  • Brokers
  • News
  • Analysis
  • Signals
    • Best Copy / Social Trading Platforms
    • eToro Review
    • FXTM Invest Review
    • Marketclub Review
    • ZuluTrade Review
  • Indicators
  • Strategies
  • Articles

The Crypto 10 Index

August 13, 2019 by James Woolley Leave a Comment

Introduction

Cryptocurrencies have exploded in popularity in recent years as more and more people learn more about them, and see the potential of these digital / virtual currencies in the years ahead.

As a result of this, some speculators inevitably want to try and make some money by either investing in or trading these cryptocurrencies, whether it’s one of the most popular cryptocurrencies such as Bitcoin, or whether it’s one of the newer relatively unknown ones that has a lot more potential to explode in value.

It is now relatively easy to buy one or more of these cryptos online, but if you are unsure which one has the most potential, or if you are just bullish about the prospects of all the major cryptos, you may be interested to know that there is now a Crypto 10 index that you can trade that includes the 10 most popular cryptocurrencies.

History / Performance

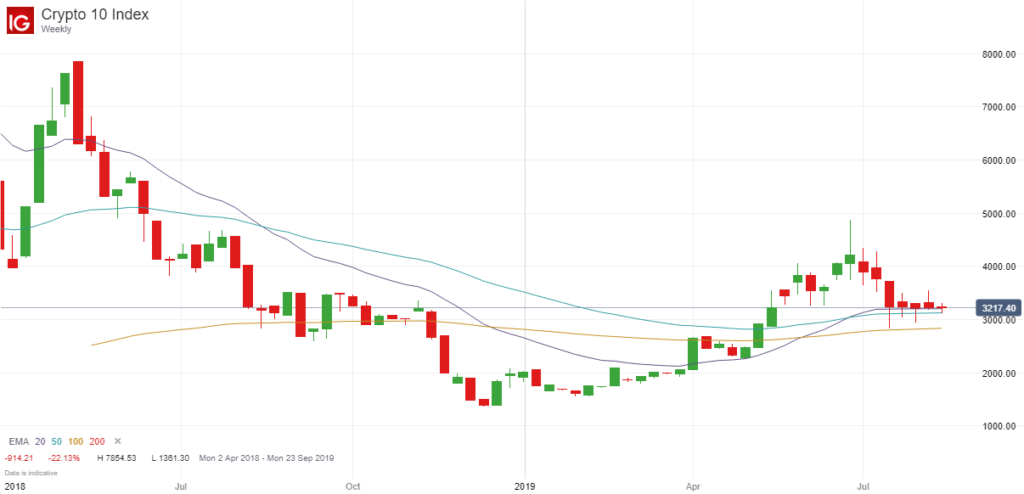
This index was originally launched a few years back as far as I understand, and at the time of writing it is currently up 58.16% since the start of the year, demonstrating the renewed strength and bullishness of the general cryptocurrency market in recent months.

Crypto 10 Index Weekly Chart

Crypto 10 Index Cryptocurrencies

As I said earlier, this index includes ten of the largest and most actively traded cryptocurrencies in terms of market capitalization, all of which are listed below:

  • Bitcoin
  • Ethereum
  • Ripple
  • Litecoin
  • Bitcoin Cash
  • EOS
  • Bitcoin SV
  • Cardano
  • Monero
  • Dash

It is a weighted index which means that the larger cryptos will influence the price movement of the index a lot more that the smaller ones, but it will still give you exposure to many of the most popular cryptos in the world without having to buy any of them individually.

Where to Trade the Crypto 10 Index

I first learned about this particular index on IG.com, and have actually added it to my shortlist and been tracking its price movement ever since, but I understand that it is also possible to trade this index through Plus 500 as well.

It is worth noting that as well as being able to open long positions, you can also enter short positions if you feel that many of the major coins are overvalued and likely to fall in the near future, which gives you a lot more options as a trader.

Final Thoughts

It should be pointed out that this is not the only index that groups together many of the most popular cryptocurrency tokens. You will find that some brokers have developed their own indexes that enables their customers to buy or sell a large basket of cryptocurrencies.

However I just thought I would bring it to your attention because I know that many of my readers like to trade with IG, and a few people have asked me if there are any indexes or ETFs that include all of the most popular tokens collectively. So hopefully you will find this article useful.

Please remember that cryptocurrencies are highly speculative, and it is possible to lose all of your capital.

Filed Under: News Tagged With: bitcoin, crypto 10, cryptocurrencies

Bitcoin Surges Above $8000 After Inside Bar Breakout

May 16, 2019 by James Woolley Leave a Comment

Previous Price Action

For a long while, it looked like the price of Bitcoin was just going to continue to trade in a sideways trading range between $3500 and $4000.

However there was a large breakout candle on 2 April, and in the following days there was enough momentum to push the price above the key $5000 level.

The price then stabilized between $5000 and $5600 for the next three weeks or so and it looked like this was going to be the new trading range in the following days and weeks.

Inside Bar

On 25 April, however, there was quite a large bearish candle on the daily chart, which propelled the price back towards $5000, and it looked like it could be heading a lot lower if it could close below this level.

As it turned out, the downward breakout failed to materialise and this actually became an inside bar because the trading range of the next seven days all fell within the high and low of this initial inside bar.

This is always a good thing to see on the daily chart because it is often the pre-cursor to a large breakout either upwards or downwards, and that’s exactly what happened here.

Upward Price Breakout

As you can see in the chart below, the price eventually broke out of this trading range (and closed above the high of the inside bar) on 3 May at $5689, and this would have been a great time to enter a long position because the price has since surged to more than $8000 thanks to the upwards momentum of this breakout.

Bitcoin Inside Bar Breakout - April May 2019

This would have represented a gain of nearly 50% for those people who held on to this position until now, but $6000 was breached fairly easily and a gain of 10-20% was still easily achievable once the momentum started building.

Final Thoughts

The point I want to get across is that as I have highlighted many times before on this site, these inside bar breakouts are always worth looking out for on the daily price charts because they can be extremely profitable.

You will generally find that the longer the price trades within the range of the initial set-up bar, also referred to as an inside bar, the more likely it is that there will be a strong breakout when the price closes outside of this range, and that was exactly the case here.

In this instance the price of Bitcoin traded within the range of the initial set-up bar for seven consecutive days, and so it was almost inevitable that the price would continue to rise strongly once the price closed outside of this range.

The problem is that these inside bars don’t necessarily occur that often, but if you monitor lots of different currency pairs, and a range of cryptocurrencies, indices and commodities, you should find a few really good set-ups every month.

Filed Under: Analysis Tagged With: bitcoin, breakout, inside bar

Bitcoin Finally Breaks Out… But To The Downside

November 15, 2018 by James Woolley Leave a Comment

Bitcoin’s Trading Action

The price of Bitcoin has remained steady for quite some time now because it has continued to trade within a fairly predictable sideways trading range between around $5900 and $6800.

I think it is fair to say that many people, particularly those people who have purchased some Bitcoins as a long-term investment, expected the price to eventually break upwards out of this trading range when the breakout finally happened.

Therefore I think many will have been shocked to see the price drop sharply downwards yesterday. The price hit a new low for 2018 of $5304, according to my IG chart, but has since recovered slightly to $5555 at the time of writing. However it is still well below the previous trading range, as you can see below:

Bitcoin Downward Breakout - November 2018

Cryptocurrency Sell-Off

It is not just Bitcoin that has experienced heavy price falls either because all of the other major cryptos have dropped sharply.

Bitcoin Cash experienced the biggest falls, but cryptos such as Ethereum, Litecoin and Ripple were also affected.

The question is; is this the end for cryptocurrencies, or this just a temporary set-back?

Future of Cryptocurrencies

The reality is that no-one really knows. I personally have never purchased any cryptocurrencies or traded them long or short, and don’t really intend to either because to me it is just gambling.

Yes these assets could well be the future and the price could easily move dramatically higher in the future, but they could just as easily become completely worthless in a few years.

Some of the most well-known cryptos may not be around in a few years time, and there may end up being one or two dominant ones that make all the other ones practically worthless. Indeed the biggest cryptos in 2020 in beyond may not even have been invented yet.

As I say, there is just too much uncertainty to trade these assets with any real confidence, but at least now we have finally seen a breakout on Bitcoin, even it is a negative breakout. This should create some decent trading opportunities for those traders who like to trade these assets on a short or medium-term basis.

Filed Under: News Tagged With: bitcoin, breakout, cryptocurrencies

Why It Is Almost Impossible To Day Trade Bitcoin

October 19, 2018 by James Woolley Leave a Comment

Popularity of Bitcoin

Bitcoin ImageCryptocurrencies such as Ripple, Litecoin, Ethereum and Dash are continually being mentioned on the various different financial news channels and websites , but it is fair to say that Bitcoin is still the most well-known of these cryptocurrencies, and the most talked about.

Many people have chosen to actively buy some Bitcoin coins in the last five years or so and hold on to them as a long-term investment, but others now prefer to trade the price movements of Bitcoin over the course of several days or weeks via CFDs because they can open long positions and short positions.

However while it is true that many brokers now offer CFDs for Bitcoin and many of the other popular cryptocurrencies, it is worth pointing out that these markets are still not really suitable for day trading.

Here are some of the reasons why:

Low Average Daily Trading Range

There was a time at the end of 2017 and the beginning of 2018 when the price of Bitcoin used to fluctuate by around 1500-1900 points a day, but volatility has been steadily declining throughout 2018, and the average daily trading range is now just 208 points.

Therefore this makes it very difficult to make money from if you are just looking to hold on to a position for no more than a few hours, and don’t want to hold any overnight positions.

It is hard enough to predict where the price is heading in the next few weeks or months, but it is even harder trying to correctly predict the direction of the price on any given day.

Large Spreads

Following on from the last point, even if you were able to correctly predict the price direction of Bitcoin on a daily basis, the large spreads would massively eat into your profits.

As stated above, the average daily trading range is currently just over 200 points. So when you bear in mind that many of the leading CFD brokers have spreads of between 50 and 150 points, it is practically impossible to consistently make money from short-term day trades.

Easy Markets have spreads from 45 points on Bitcoin, which is very reasonable, but this still isn’t low enough to make Bitcoin a viable day trading instrument.

Large Margin Requirements

There is one other factor that restricts the ability for traders to day trade Bitcoin, and that’s the large margin requirements.

Many brokers require greater margin for cryptocurrencies than other markets because they are viewed as being a lot more risky, and this is particularly the case for Europe-based traders because the new ESMA rules require a margin of at least 50% when trading cryptos.

Final Thoughts

As you can see, there are many reasons why Bitcoin is not really suitable for day traders at the present time.

The large spreads and the large margin requirements, combined with the low average trading range make this virtually impossible to make money from right now.

Therefore if you are someone who is looking to trade Bitcoin, you should take a longer term view and be prepared to hold on to your positions for days, weeks or months at a time because then these factors will be less of an issue, even if you have to pay a small daily financing charge for holding long positions overnight.

If you open a long position and the price of Bitcoin goes up by $500 or $1000 one week later, then a $50 spread won’t eat into your profits too much, and the daily financing charges will be relatively small.

Over time the spreads may start to come down, and there is a possibility that the ESMA may lower their margin requirements for European traders. However until that happens, it is probably better to look for breakouts or price reversals, for example, and wait for the big price moves to occur, which are obviously more likely to occur over the course of several days rather than a few hours.

Filed Under: News Tagged With: bitcoin, cryptocurrencies, day trading

Bitcoin’s Peaks Are Getting Lower – Needs To Break Above $7000

September 28, 2018 by James Woolley Leave a Comment

Bitcoin Predictions

It is always interesting to keep an eye on the price of Bitcoin because in the past we have seen some crazy price swings.

Indeed there was a time when it rocketed up to around the $20,000 level and so-called experts were throwing out outlandish price targets.

For example, venture capitalist Tim Draper set a price target of $250,000 and John Pfeffer (a partner of Pfeffer Capital) set a price target of $700,000, while the controversial figure John McAfee suggested that the price of Bitcoin could even hit $1,000,000 by 2020.

Maybe these predictions will come true in the future, but at the moment they seem absolutely crazy based on the recent price action.

Bitcoin’s Recent Price Action

The chart below shows how the price of Bitcoin has moved since April, and it is clear to see that there has been a steady decline downwards.

Bitcoin Chart - September 2018

There have been times when the price has surged higher, but nevertheless the highs have been getting lower and lower, and just recently the price seems to have been stuck in a sideways trading range between around $5800 and $6600, with no real momentum to take it higher.

This week we have seen a little more strength with the price now trading at $6776 at the time of writing, but it is still far too early to call this a bull run.

Upward Price Breakout / Trading Opportunity

If I was looking to trade a possible breakout, I would look for two events to occur.

First of all, I would want the price to close above its most recent September highs ($6774) because this would push the price above the most recent trendline and potentially signal a short-term breakout.

Secondly, I would want to see the longer term trendline being broken because this would show significant strength, and may possibly bring a wave of new buying because it would encourage traders and investors to buy into this upward price breakout.

For these two things to happen, the price of Bitcoin is going to need to break through the $7000 level, and possibly as high as $7200 or $7300 (depending on when it occurs). However this is still quite a big ask because the price has been trading in the $6000s for quite some time now, so there is obviously a chance that it won’t happen at all.

There will be a breakout at some point, but it could easily be a downward breakout below $5800 if this latest breakout attempt fails to materialise.

Please note that these are just my own thought and opinions. I am not providing any trading advice or recommending any trades. Bitcoin trading is exceptionally risky and you should always be aware of these risks before entering any trades.

Filed Under: Analysis Tagged With: bitcoin, bitcoin price, breakout

  • « Previous Page
  • 1
  • 2
  • 3
  • Next Page »

Forex Rebates:

Choose from 40+ different forex brokers and crypto exchanges, and get cashback every time you trade:


Copy Profitable Traders:

If you join ZuluTrade, you can follow and subscribe to profitable traders and all of their trades will be automatically copied in your own trading account.

You can also earn money as a signal provider if you are already a profitable trader.

Click here to find out more

Recommended Broker:

Recent Blog Posts:

  • High Probability Trade on S&P 500 – 26 January 2024
  • Oanda Moves Into Prop Trading With Labs Trader Program
  • My eToro Performance in 2023 – Up 33.24%
  • The5ers Offering $20K Bootcamp Challenge For Just $1
  • Example of VWAP Bounce Trade on S&P 500 – 18 December 2023

Recent Articles:

VWAP Indicator
  • MA Sabres (LuxAlgo) Indicator
  • 10 Harsh Truths About Forex Trading
  • Best Websites for Monitoring Currency Strengths
  • Xmaster Formula Indicator for MT4 and MT5
  • Tools:

    Currency Heat Map

    Categories

    • Analysis
    • News

    Archives

    • January 2024
    • December 2023
    • November 2023
    • October 2023
    • September 2023
    • August 2023
    • July 2023
    • June 2023
    • May 2023
    • August 2020
    • June 2020
    • May 2020
    • April 2020
    • January 2020
    • December 2019
    • November 2019
    • October 2019
    • September 2019
    • August 2019
    • July 2019
    • June 2019
    • May 2019
    • April 2019
    • March 2019
    • February 2019
    • January 2019
    • December 2018
    • November 2018
    • October 2018
    • September 2018
    • August 2018
    • July 2018
    • June 2018
    • May 2018
    • March 2016
    • December 2015
    • November 2015
    • October 2015
    • August 2015
    • July 2015

    Disclaimer

    This website should be used for general information purposes only and in no way represents professional financial advice.

    Forex and CFD trading carries a high level of risk and it is possible to lose more than your initial deposit if using leveraged products.

    Copyright © 2025 · eleven40 Pro Theme on Genesis Framework · WordPress · Log in

    • About
    • Contact
    • Disclosure
    • Privacy Policy
    • Terms Of Service